
If you run Linux or Windows servers behind Nginx or Apache, you already have a goldmine of operational data sitting in your access logs — and no easy way to read it. This tutorial builds a self-contained Ruby command-line tool that parses those logs, summarizes traffic patterns, and raises an alert when your error rate crosses a threshold you choose. It is the kind of script you can drop into a cron job tonight and have real visibility into your web server by tomorrow morning.
The problem this solves
Access logs answer questions that matter every single day: which IPs are hammering your server, which endpoints are slow, and whether your 500 error rate just spiked after a deploy. Most teams either pay for a log aggregation platform they don’t fully need, or they never look at the logs at all until something is already on fire. Ruby’s standard library — Regexp, OptionParser, and Struct — is more than enough to build a fast, dependency-free analyzer that answers those questions in under a second, on a log file with tens of thousands of lines.
Prerequisites
You will need:
- Ruby 2.7 or newer (this was written and tested on Ruby 3.0). No gems required — everything used ships in Ruby’s standard library.
- A Linux or Windows machine with an Nginx or Apache access log in the standard “combined” log format (the default for both servers).
- Read access to the log file (or root/sudo if you’re pointing it at
/var/log/nginx/access.logdirectly).
How it works
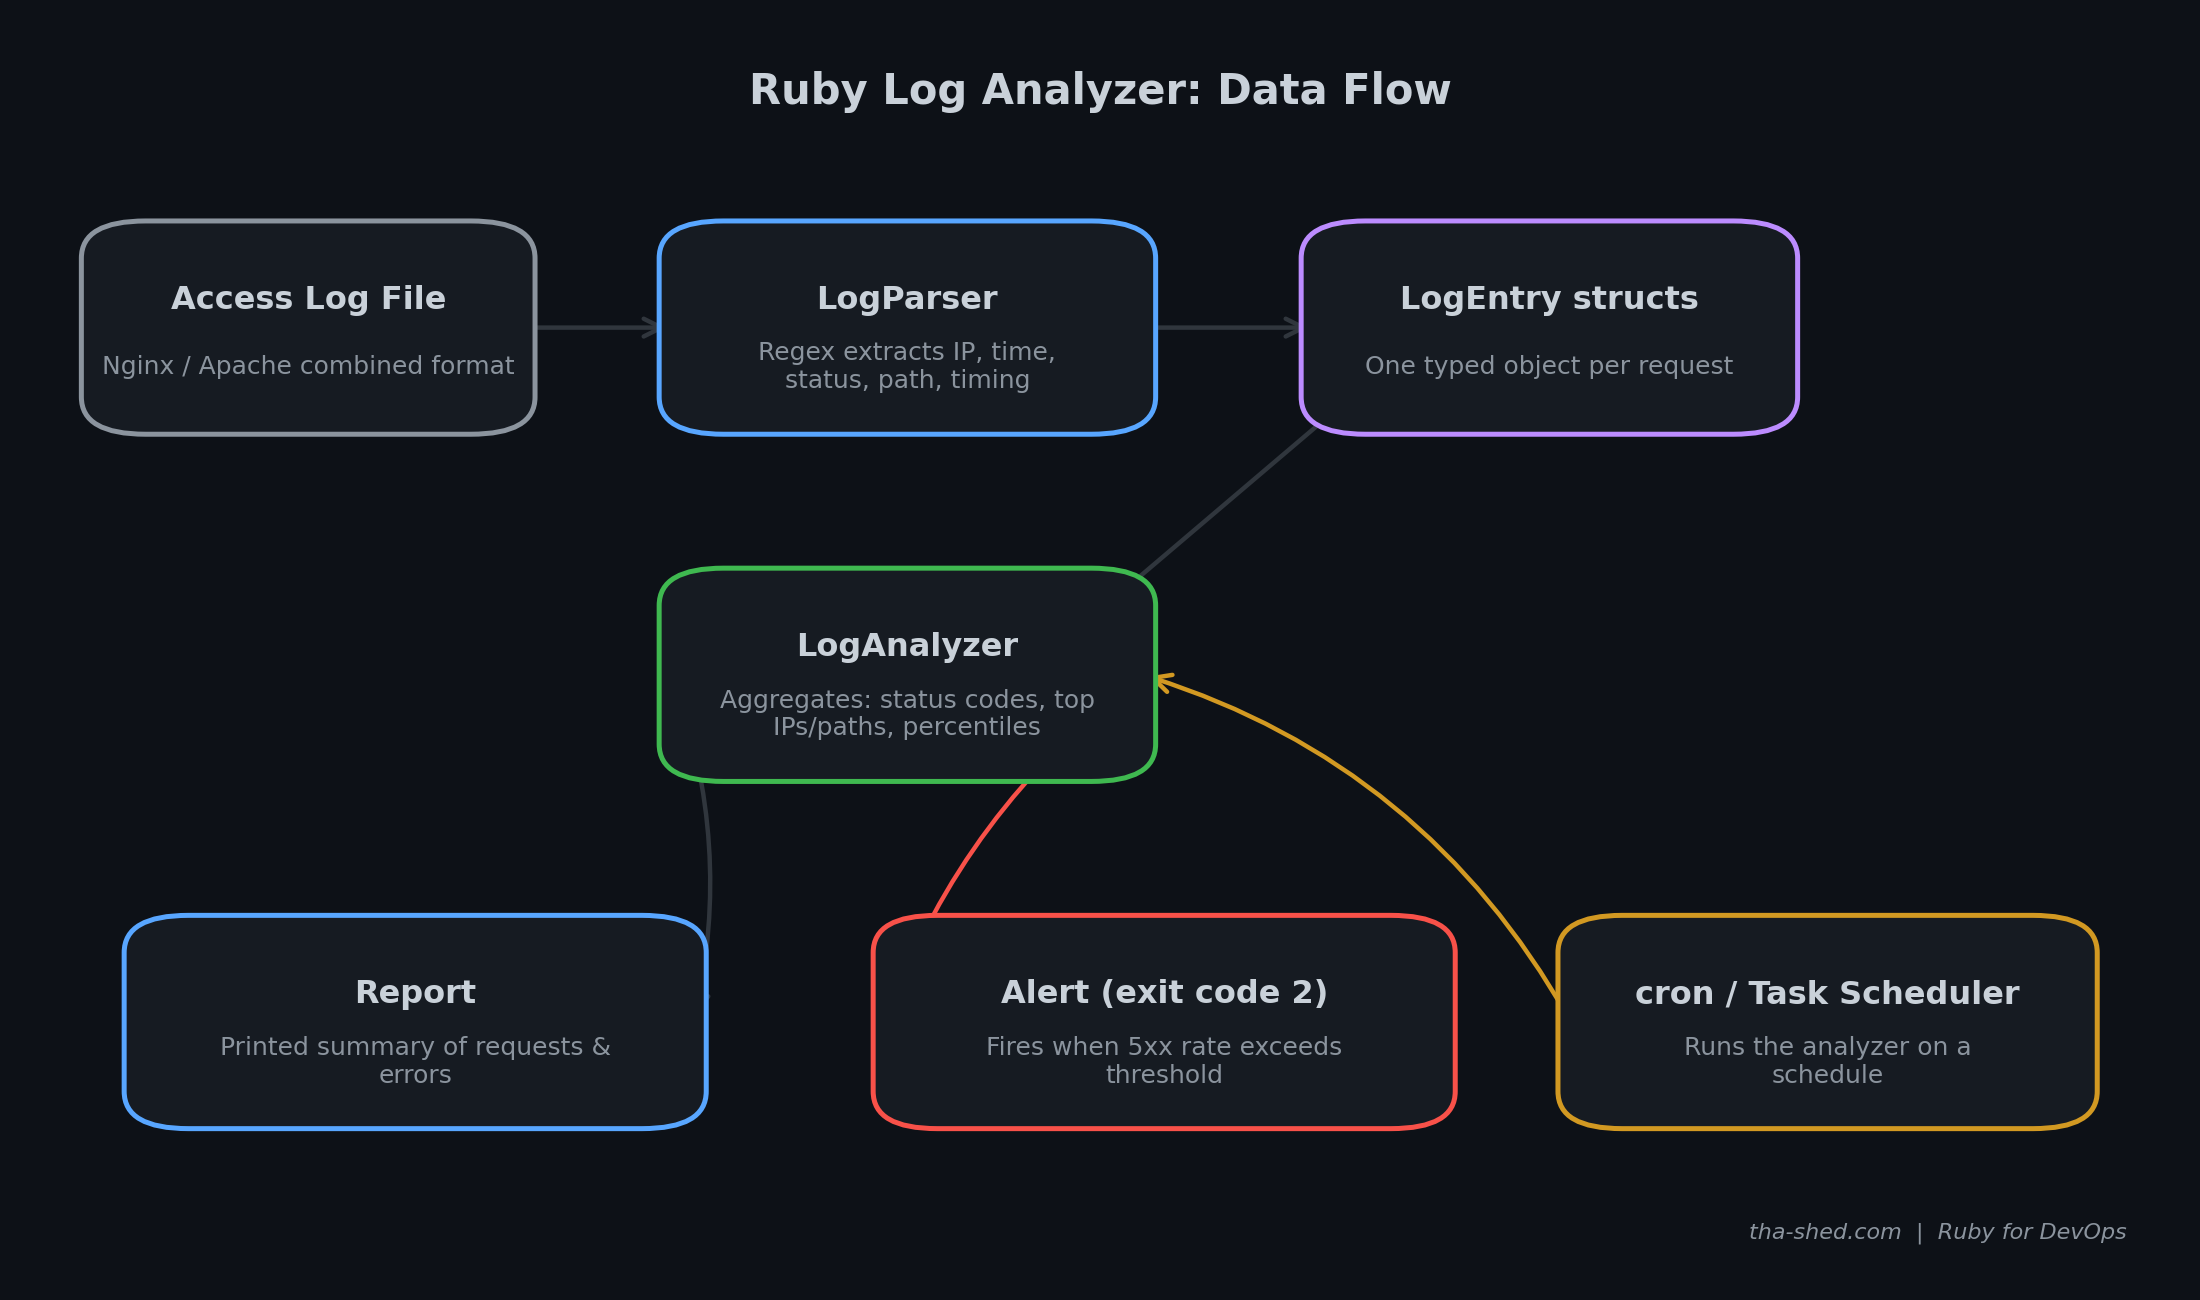
The script is split into three small, single-purpose classes rather than one big script, which makes it much easier to test and extend:
- LogParser turns one raw log line into a typed
LogEntrystruct using a single regular expression with named captures. - LogEntry is a lightweight value object (a
Struct) that also knows how to classify itself as a client error (4xx) or server error (5xx). - LogAnalyzer collects
LogEntryobjects one at a time (so it can process a file of any size without loading everything into memory twice) and computes the aggregate statistics on demand.
The complete code
Save this as log_analyzer.rb. It is fully self-contained — no gems to install.
#!/usr/bin/env ruby
# log_analyzer.rb
#
# A Ruby-based log analyzer for Nginx/Apache "combined" access logs.
#
# It parses a log file, computes summary statistics (status code
# breakdown, top client IPs, top requested paths, response-time
# percentiles) and raises an alert if the error rate crosses a
# configurable threshold. Designed to run as a one-off report tool
# or on a cron schedule for daily/hourly log review.
#
# Usage:
#   ruby log_analyzer.rb /var/log/nginx/access.log
#   ruby log_analyzer.rb /var/log/nginx/access.log --error-threshold 5
#   cat access.log | ruby log_analyzer.rb -
#
# Author: tha-shed.com tutorials

require 'optparse'
require 'time'

# ---------------------------------------------------------------------------
# LogEntry: a small value object representing one parsed access-log line.
# ---------------------------------------------------------------------------
LogEntry = Struct.new(:ip, :time, :method, :path, :status, :bytes, :response_time) do
  def error?
    status >= 500
  end

  def client_error?
    status >= 400 && status < 500
  end
end

# ---------------------------------------------------------------------------
# LogParser: turns raw lines into LogEntry objects.
#
# Matches Nginx/Apache "combined" log format, with an optional trailing
# request-time field (common in Nginx configs that add $request_time):
#
#   127.0.0.1 - - [10/Oct/2023:13:55:36 +0000] "GET /index.html HTTP/1.1" 200 612 "-" "curl/7.68.0" 0.002
# ---------------------------------------------------------------------------
class LogParser
  # Named captures keep the regex readable and let us build a LogEntry
  # directly from `match.named_captures`.
  # Uses %r{...} instead of /.../ so literal slashes inside comments and
  # the date string (e.g. 10 Oct 2023) don't need escaping.
  LINE_REGEX = %r{
    ^(?<ip>\S+)\s+           # client IP
    \S+\s+\S+\s+             # ident, authuser (usually "-")
    \[(?<time>[^\]]+)\]\s+   # timestamp, e.g. 10 Oct 2023 13:55:36 +0000
    "(?<method>[A-Z]+)\s+(?<path>\S+)\s+[^"]*"\s+ # e.g. GET /path HTTP/1.1
    (?<status>\d{3})\s+      # status code, e.g. 200
    (?<bytes>\S+)            # bytes sent, e.g. 612 or -
    (?:\s+"[^"]*"\s+"[^"]*")? # optional referrer/user-agent
    (?:\s+(?<rt>[\d.]+))?    # optional trailing request time in seconds
  }x

  def self.parse_line(line)
    m = LINE_REGEX.match(line)
    return nil unless m

    LogEntry.new(
      m[:ip],
      begin
        Time.strptime(m[:time], '%d/%b/%Y:%H:%M:%S %z')
      rescue ArgumentError
        nil
      end,
      m[:method],
      m[:path],
      m[:status].to_i,
      m[:bytes] == '-' ? 0 : m[:bytes].to_i,
      m[:rt] ? m[:rt].to_f : nil
    )
  end
end

# ---------------------------------------------------------------------------
# LogAnalyzer: aggregates LogEntry objects into a report.
# ---------------------------------------------------------------------------
class LogAnalyzer
  def initialize(error_threshold_pct: 5.0, top_n: 5)
    @entries = []
    @unparsed = 0
    @error_threshold_pct = error_threshold_pct
    @top_n = top_n
  end

  def feed(line)
    entry = LogParser.parse_line(line)
    if entry
      @entries << entry
    else
      @unparsed += 1
    end
  end

  def total
    @entries.size
  end

  def status_breakdown
    @entries.group_by(&:status).transform_values(&:size).sort.to_h
  end

  def top_ips
    @entries.group_by(&:ip).transform_values(&:size).sort_by { |_, c| -c }.first(@top_n)
  end

  def top_paths
    @entries.group_by(&:path).transform_values(&:size).sort_by { |_, c| -c }.first(@top_n)
  end

  def error_count
    @entries.count(&:error?)
  end

  def client_error_count
    @entries.count(&:client_error?)
  end

  def error_rate_pct
    return 0.0 if total.zero?
    (error_count.to_f / total * 100).round(2)
  end

  def response_times
    @entries.map(&:response_time).compact.sort
  end

  def percentile(p)
    times = response_times
    return nil if times.empty?
    idx = ((p / 100.0) * (times.size - 1)).round
    times[idx]
  end

  def alert?
    error_rate_pct >= @error_threshold_pct
  end

  def report
    lines = []
    lines << '=' * 60
    lines << 'LOG ANALYSIS REPORT'
    lines << '=' * 60
    lines << "Total requests parsed : #{total}"
    lines << "Unparsed lines        : #{@unparsed}"
    lines << ''
    lines << '-- Status code breakdown --'
    status_breakdown.each { |code, count| lines << "  #{code}: #{count}" }
    lines << ''
    lines << "-- Top #{@top_n} client IPs --"
    top_ips.each { |ip, count| lines << "  #{ip}: #{count} requests" }
    lines << ''
    lines << "-- Top #{@top_n} requested paths --"
    top_paths.each { |path, count| lines << "  #{path}: #{count} requests" }
    lines << ''
    unless response_times.empty?
      lines << '-- Response time (seconds) --'
      lines << "  p50: #{percentile(50)}  p90: #{percentile(90)}  p99: #{percentile(99)}"
      lines << ''
    end
    lines << "Client errors (4xx): #{client_error_count}"
    lines << "Server errors (5xx): #{error_count}"
    lines << "Error rate: #{error_rate_pct}% (alert threshold: #{@error_threshold_pct}%)"
    if alert?
      lines << ''
      lines << "*** ALERT: error rate #{error_rate_pct}% exceeds threshold #{@error_threshold_pct}% ***"
    end
    lines << '=' * 60
    lines.join("\n")
  end
end

# ---------------------------------------------------------------------------
# CLI entry point
# ---------------------------------------------------------------------------
if __FILE__ == $PROGRAM_NAME
  options = { error_threshold: 5.0, top_n: 5 }
  parser = OptionParser.new do |opts|
    opts.banner = 'Usage: log_analyzer.rb LOGFILE [options]  (use "-" to read stdin)'
    opts.on('--error-threshold PCT', Float, 'Alert if 5xx error rate >= PCT (default 5.0)') do |v|
      options[:error_threshold] = v
    end
    opts.on('--top N', Integer, 'Number of top IPs/paths to show (default 5)') do |v|
      options[:top_n] = v
    end
  end
  parser.parse!

  path = ARGV.shift
  if path.nil?
    warn parser.banner
    exit 1
  end

  analyzer = LogAnalyzer.new(error_threshold_pct: options[:error_threshold], top_n: options[:top_n])

  io = path == '-' ? $stdin : File.open(path, 'r')
  begin
    io.each_line { |line| analyzer.feed(line) }
  ensure
    io.close unless path == '-'
  end

  puts analyzer.report
  exit(analyzer.alert? ? 2 : 0)
end
Step-by-step walkthrough
The regex. LINE_REGEX uses Ruby’s %r{...}x extended syntax instead of the usual /.../ delimiters. This matters more than it looks: the extended mode lets you spread the pattern across multiple lines with inline comments, which is the only way to keep a regex this complex readable six months from now. Using %r{...} instead of /.../ also means literal slashes — like the ones in a date such as “10/Oct/2023” — don’t need to be escaped or, worse, silently truncate your regex.
Named captures. Every group in the regex is named (?<ip>, ?<status>, and so on), so LogParser.parse_line can pull fields out with m[:ip] instead of tracking numbered groups by position. If you ever need to add a field, you just add a named group — nothing downstream breaks.
Streaming, not slurping. The CLI reads the file with io.each_line rather than File.read, so LogAnalyzer processes one line at a time. On a multi-gigabyte log file this is the difference between constant memory usage and an out-of-memory crash.
The alert exit code. When the 5xx error rate meets or exceeds your --error-threshold, the script exits with status code 2 instead of 0. This is deliberate: it lets you wire the script directly into cron with a mailer, or into a monitoring system that treats non-zero exit codes as failures, with zero extra glue code.
Example output
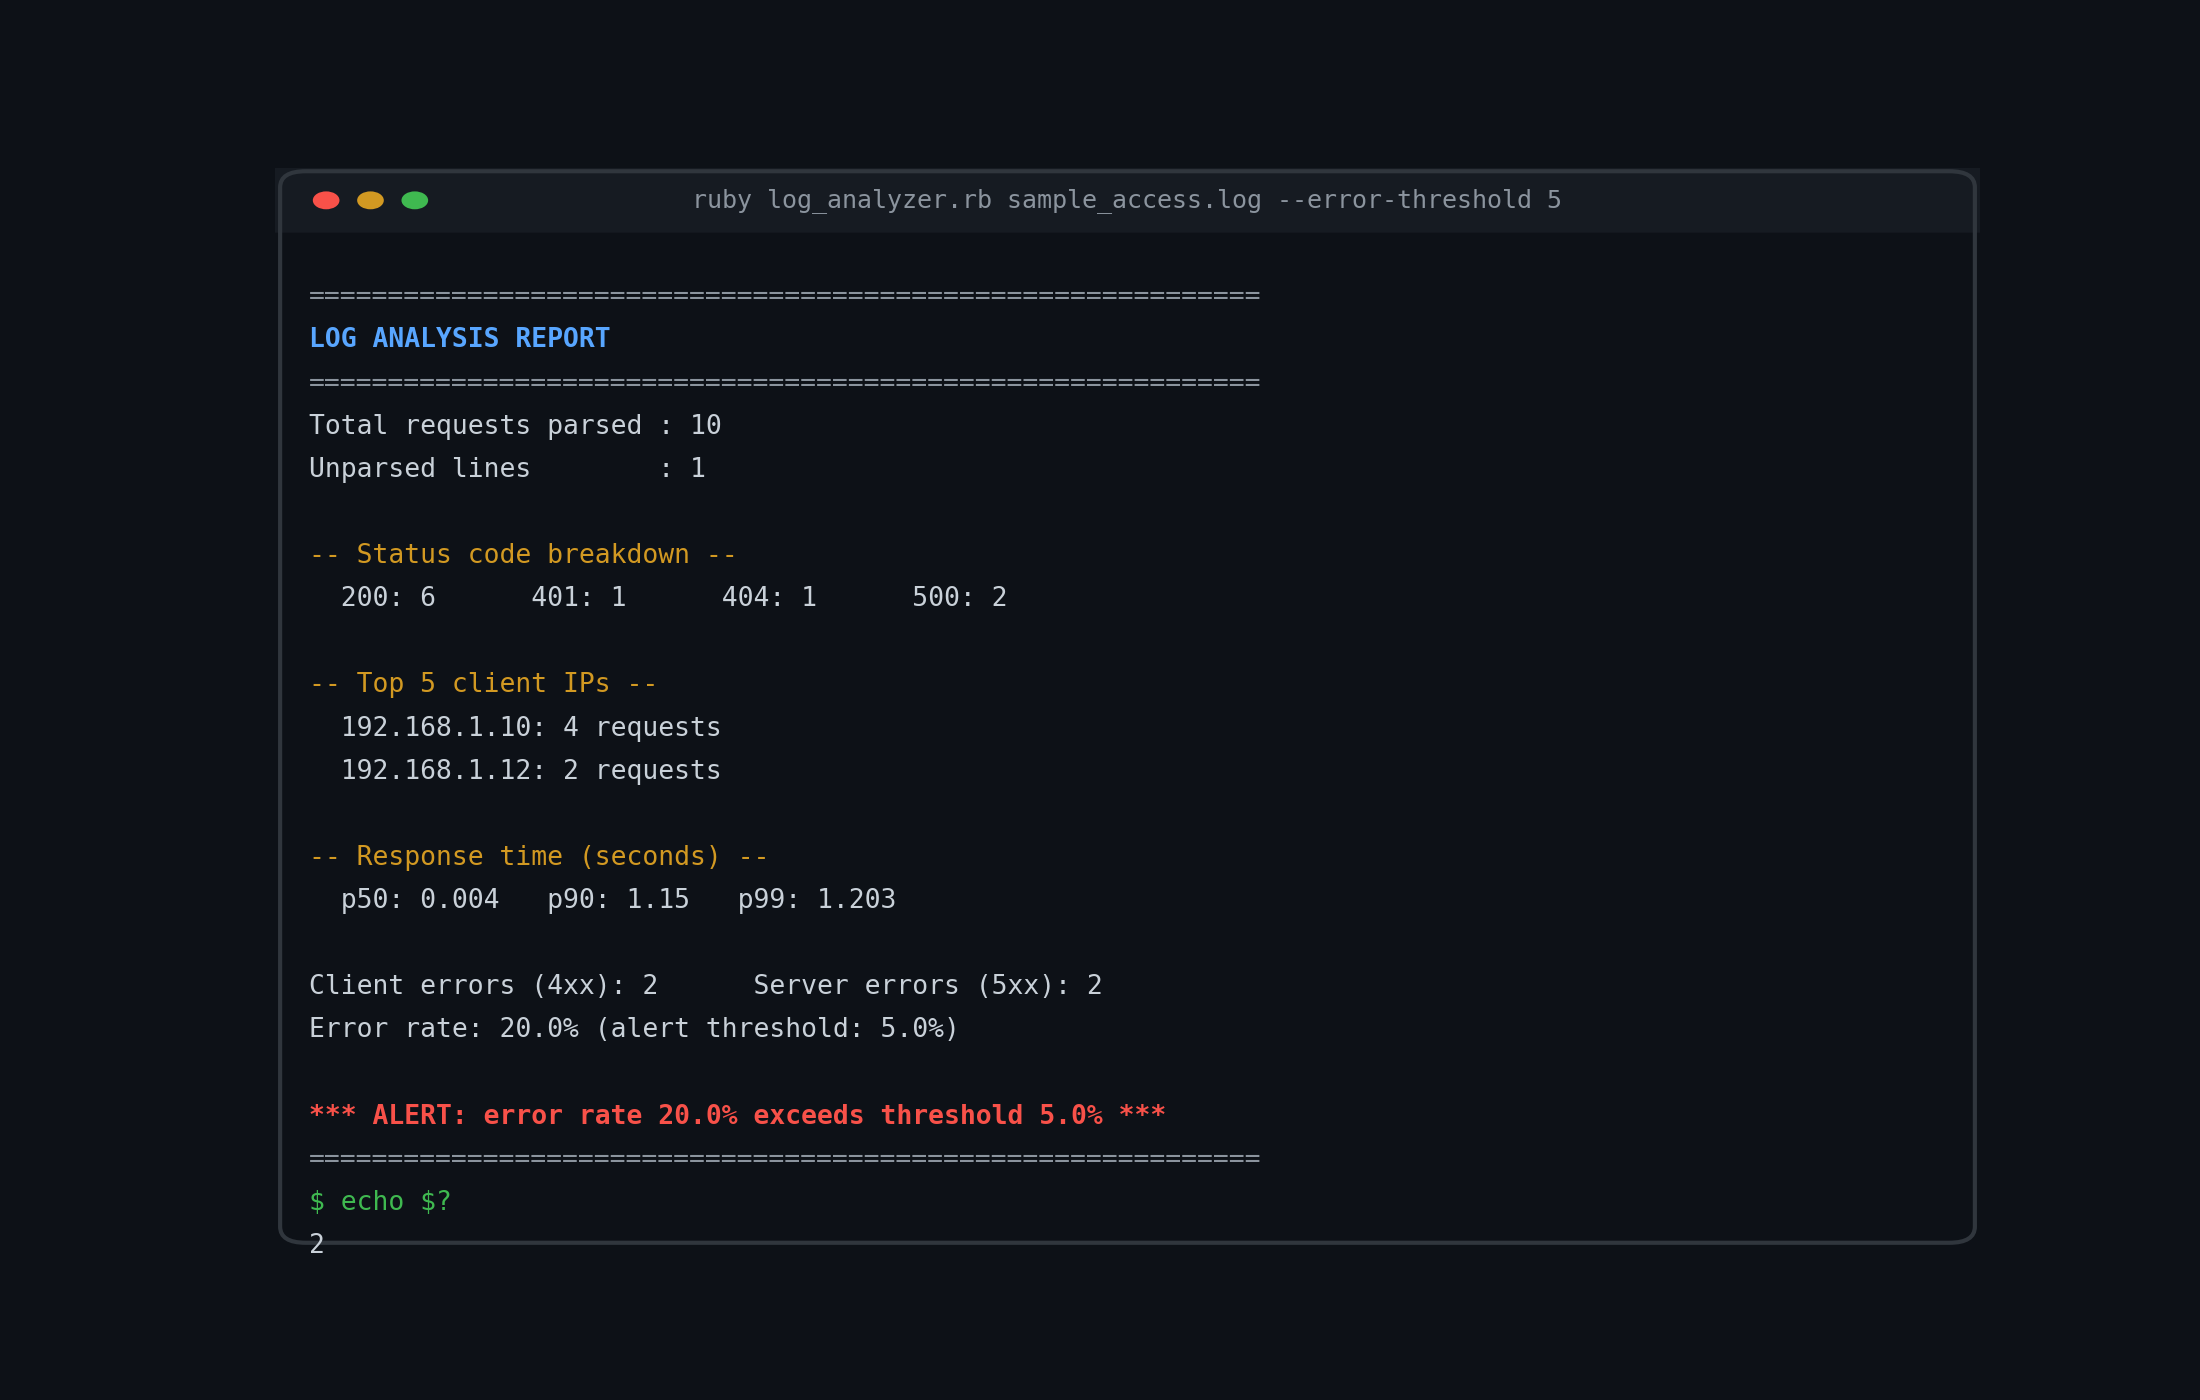
Running the analyzer against a sample log with a mix of 200s, 401s, 404s, and 500s produces a full report and, because the error rate exceeds the default 5% threshold, an alert:
Usage
# Analyze a log file directly
ruby log_analyzer.rb /var/log/nginx/access.log

# Only alert if the 5xx rate hits 10% or higher
ruby log_analyzer.rb /var/log/nginx/access.log --error-threshold 10

# Show the top 10 IPs and paths instead of the default 5
ruby log_analyzer.rb /var/log/nginx/access.log --top 10

# Pipe logs in from anywhere, e.g. journalctl or a remote tail over SSH
cat access.log | ruby log_analyzer.rb -

# Wire it into cron, alerting only when the exit code signals a problem
* * * * * ruby /opt/scripts/log_analyzer.rb /var/log/nginx/access.log --error-threshold 5 || mail -s "High error rate" ops@example.com < /dev/null
Troubleshooting
“Unparsed lines” is high or equal to my total line count. Your log format doesn’t match the standard “combined” format the regex expects. Check whether your Nginx or Apache config customizes the log_format directive — if so, adjust LINE_REGEX to match your actual field order. Printing a raw unparsed line with puts line inside the else branch of LogAnalyzer#feed is the fastest way to see exactly what’s not matching.
Timestamps come back as nil. Time.strptime is strict about the format string. If your logs use a different timezone format or separator, adjust the format string '%d/%b/%Y:%H:%M:%S %z' to match. The script degrades gracefully here — a bad timestamp doesn’t crash the run, it just means that entry’s time field is nil.
Response times never show up in the report. The trailing request-time field is optional in the regex because not every Nginx/Apache config logs it. Add $request_time (Nginx) or %D (Apache) to the end of your log format directive if you want percentile timing in the report.
Permission denied reading the log file. On most distributions, /var/log/nginx/access.log is only readable by root or the adm group. Run the script with sudo, or add your user to the appropriate group.
Extending this script
- Ship alerts somewhere useful. Instead of relying on the exit code alone, POST the report to a Slack webhook or PagerDuty when
analyzer.alert?is true. - Track trends over time. Append each run’s summary line (timestamp, total requests, error rate) to a CSV file, and you have a lightweight time series you can graph without standing up a metrics stack.
- Support log rotation and gzip. Use
Zlib::GzipReaderto transparently readaccess.log.1.gzstyle rotated logs alongside the live file. - Filter by time window. Parse the
timefield and only include entries from the last N minutes, so the script can run frequently and only report on recent activity. - Add a JSON output mode alongside the human-readable report, so the script can feed structured data into other tools.
Sign in to take Cornell notes on this lesson — they save automatically and stay with your account.