/proc.Etc.nprocessors divides load by core count — a number that means the same thing on any box.EXTEND — per-core breakdown + memory pressure
Part of our Ruby for DevOps series — practical Ruby scripts that solve real system-administration problems.
The Problem
Not every box needs a full Prometheus/Grafana stack just to answer “is this server under unusual load right now?” Sometimes you want a single lightweight script — no gems, no agent to install, no exporter to configure — that a cron job or systemd timer can run every minute and alert on. Linux already exposes everything you need in /proc; the trick is reading it correctly.
A single read of /proc/stat only gives you cumulative CPU-time counters since boot, which by itself tells you nothing about current load — you have to sample it twice and look at the delta. And a raw load average is meaningless without knowing how many CPU cores the box has: a load of 4.0 is idle on a 32-core box and on fire on a 2-core one. This tutorial builds load_monitor.rb, which handles both correctly and classifies the result against configurable thresholds.
Prerequisites
- Ruby 2.7 or later (only the standard library
etcmodule is used, for CPU core count — no gems) - Linux (this reads
/proc/loadavgand/proc/statdirectly, so it won’t run on macOS or Windows) - No special privileges required — both files are world-readable
The Code
Save this as load_monitor.rb:
#!/usr/bin/env ruby
# frozen_string_literal: true
# load_monitor.rb
#
# A zero-gem CPU / load-average watchdog for Linux, reading straight from
# the /proc filesystem -- no `top`, `vmstat`, or external gem required.
# Useful for a lightweight alert that runs from cron or a systemd timer
# on boxes where you don't want to install a full monitoring agent.
#
# What it does:
#   - Reads /proc/loadavg for the 1/5/15 minute load averages and the
#     running/total process counts.
#   - Samples /proc/stat twice, a configurable interval apart, to compute
#     real CPU utilization percentage (a single read of /proc/stat gives
#     cumulative counters since boot, which isn't useful by itself).
#   - Normalizes load average against the number of CPU cores, since a
#     load of 4 means very different things on a 2-core vs. 32-core box.
#   - Applies configurable warning/critical thresholds and prints an
#     alert (and a non-zero exit code) when they're exceeded.
#
# Prerequisites: Ruby 2.7+ on Linux (relies on /proc, so this will not
# work on macOS or Windows). No gems required.
require 'etc'
class LoadMonitor
  DEFAULT_THRESHOLDS = {
    load_per_core_warning: 0.7,
    load_per_core_critical: 1.0,
    cpu_percent_warning: 80.0,
    cpu_percent_critical: 95.0
  }.freeze
  Snapshot = Struct.new(
    :load1, :load5, :load15, :running_processes, :total_processes,
    :cpu_cores, :cpu_percent, :load_per_core, :status, :reasons,
    keyword_init: true
  )
  def initialize(proc_path: '/proc', thresholds: DEFAULT_THRESHOLDS, cpu_cores: nil)
    @proc_path = proc_path
    @thresholds = thresholds
    @cpu_cores = cpu_cores || detect_cpu_cores
  end
  # Reads /proc/loadavg once. Format: "0.38 0.26 0.11 1/167 6"
  #   -> 1-min, 5-min, 15-min load, "running/total" processes, last PID
  def read_loadavg
    line = File.read(File.join(@proc_path, 'loadavg')).strip
    parts = line.split
    load1, load5, load15 = parts[0..2].map(&:to_f)
    running, total = parts[3].split('/').map(&:to_i)
    { load1: load1, load5: load5, load15: load15, running: running, total: total }
  end
  # Parses the aggregate "cpu" line from /proc/stat into named jiffie
  # counters. See `man 5 proc` for the field meanings.
  def self.parse_cpu_line(text)
    line = text.each_line.find { |l| l.start_with?('cpu ') }
    raise 'no aggregate cpu line found in /proc/stat' unless line
    fields = line.split
    labels = %i[user nice system idle iowait irq softirq steal guest guest_nice]
    values = fields[1..].map(&:to_i)
    labels.zip(values).to_h
  end
  def read_cpu_snapshot
    self.class.parse_cpu_line(File.read(File.join(@proc_path, 'stat')))
  end
  # Given two /proc/stat samples taken `interval` seconds apart, computes
  # % CPU utilization (100% - % time spent idle) over that window.
  def self.cpu_percent_between(before, after)
    idle_before = before[:idle] + before[:iowait]
    idle_after = after[:idle] + after[:iowait]
    total_before = before.values.sum
    total_after = after.values.sum
    total_delta = total_after - total_before
    idle_delta = idle_after - idle_before
    return 0.0 if total_delta <= 0
    (100.0 * (total_delta - idle_delta) / total_delta).round(2)
  end
  def detect_cpu_cores
    Etc.nprocessors
  rescue StandardError
    1
  end
  # Takes a live sample: reads loadavg once, and samples /proc/stat twice
  # `interval` seconds apart to compute real CPU%.
  def sample(interval: 1.0)
    loadavg = read_loadavg
    before = read_cpu_snapshot
    sleep interval
    after = read_cpu_snapshot
    cpu_percent = self.class.cpu_percent_between(before, after)
    build_snapshot(loadavg: loadavg, cpu_percent: cpu_percent)
  end
  # Pure/testable: builds a Snapshot (with status + reasons) from already-
  # collected numbers, without touching /proc or sleeping. This is what
  # the test suite exercises directly.
  def build_snapshot(loadavg:, cpu_percent:)
    load_per_core = (loadavg[:load1] / @cpu_cores).round(3)
    reasons = []
    status = :ok
    if load_per_core > @thresholds[:load_per_core_critical]
      status = :critical
      reasons << "load/core #{load_per_core} > critical threshold #{@thresholds[:load_per_core_critical]}"
    elsif load_per_core > @thresholds[:load_per_core_warning]
      status = :warning
      reasons << "load/core #{load_per_core} > warning threshold #{@thresholds[:load_per_core_warning]}"
    end
    if cpu_percent > @thresholds[:cpu_percent_critical]
      status = :critical
      reasons << "cpu #{cpu_percent}% > critical threshold #{@thresholds[:cpu_percent_critical]}%"
    elsif cpu_percent > @thresholds[:cpu_percent_warning] && status != :critical
      status = :warning
      reasons << "cpu #{cpu_percent}% > warning threshold #{@thresholds[:cpu_percent_warning]}%"
    end
    Snapshot.new(
      load1: loadavg[:load1], load5: loadavg[:load5], load15: loadavg[:load15],
      running_processes: loadavg[:running], total_processes: loadavg[:total],
      cpu_cores: @cpu_cores, cpu_percent: cpu_percent, load_per_core: load_per_core,
      status: status, reasons: reasons
    )
  end
  def format_report(snapshot)
    lines = []
    lines << "Status          : #{snapshot.status.to_s.upcase}"
    lines << "Load avg (1/5/15): #{snapshot.load1} / #{snapshot.load5} / #{snapshot.load15}"
    lines << "CPU cores        : #{snapshot.cpu_cores}"
    lines << "Load per core    : #{snapshot.load_per_core}"
    lines << "CPU utilization  : #{snapshot.cpu_percent}%"
    lines << "Processes        : #{snapshot.running_processes} running / #{snapshot.total_processes} total"
    unless snapshot.reasons.empty?
      lines << 'Reasons:'
      snapshot.reasons.each { |r| lines << "  - #{r}" }
    end
    lines.join("\n")
  end
end
# ---------------------------------------------------------------------------
# CLI
# ---------------------------------------------------------------------------
if __FILE__ == $PROGRAM_NAME
  interval = 1.0
  watch = ARGV.include?('--watch')
  if (idx = ARGV.index('--interval'))
    interval = ARGV[idx + 1].to_f
  end
  monitor = LoadMonitor.new
  loop do
    snapshot = monitor.sample(interval: interval)
    puts monitor.format_report(snapshot)
    puts '-' * 40
    exit(snapshot.status == :critical ? 2 : (snapshot.status == :warning ? 1 : 0)) unless watch
    sleep [interval, 2].max
  end
end
Step-by-Step Walkthrough
Reading the load average
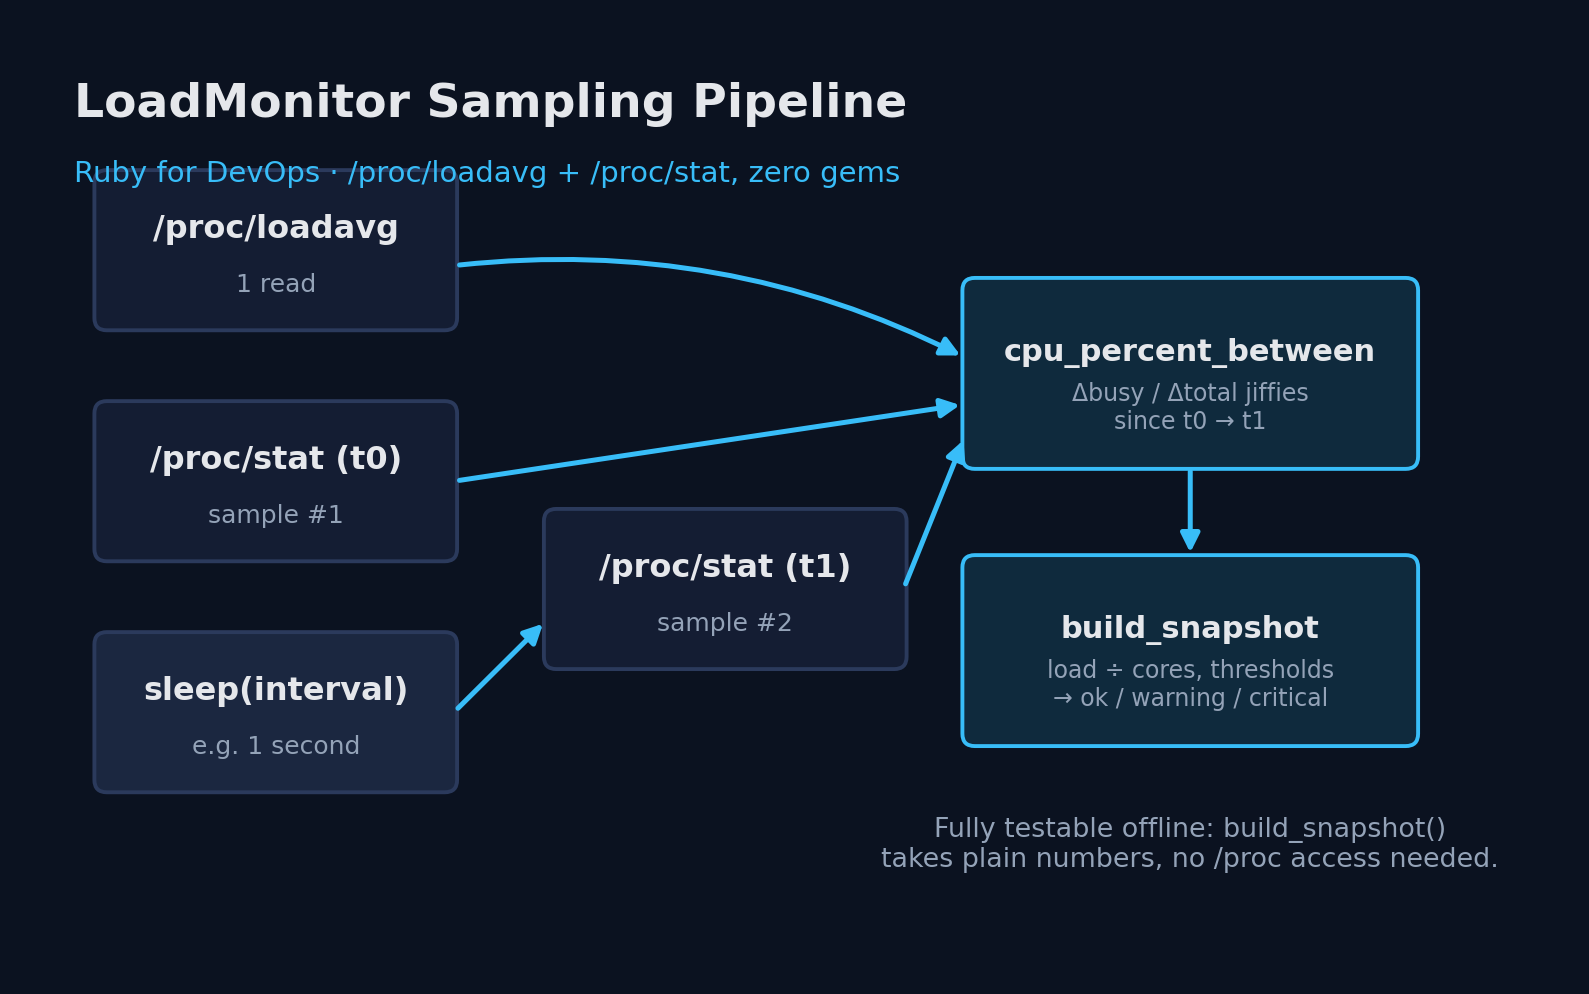
read_loadavg parses a line like 0.38 0.26 0.11 1/167 1234 from /proc/loadavg: the 1/5/15-minute load averages, followed by “currently runnable / total” process counts and the most recently created PID (which this script ignores).
Measuring real CPU utilization from two samples
/proc/stat‘s aggregate cpu line reports cumulative jiffies (a kernel time unit) spent in each state — user, nice, system, idle, iowait, and so on — since boot. A single reading is a large, ever-growing number that tells you nothing about the current moment. cpu_percent_between takes two samples and computes 1 - (Δidle / Δtotal) over that window, giving you an actual percent-busy figure for the sampling interval, the same technique tools like top use internally.
Normalizing load against core count
detect_cpu_cores uses Ruby’s built-in Etc.nprocessors (no shelling out to nproc needed) and build_snapshot divides the 1-minute load average by that count to get load_per_core — a number that means roughly the same thing regardless of how many cores the box has. A load_per_core above 1.0 means, on average, more processes are ready to run than you have cores to run them on.
Classifying and reporting
build_snapshot is deliberately separated from sample (which does the actual /proc reads and sleeping): it takes already-collected numbers and returns a Snapshot struct with a status (:ok, :warning, or :critical) and a list of human-readable reasons explaining exactly which threshold was crossed. That separation is what makes the classification logic fully unit-testable without needing to read real /proc files or wait on a real sleep.
Testing It
Because parsing and classification are separated from the actual file reads and timing, most of this script can be tested with plain sample data — and the parts that do read /proc were also run live against this tutorial’s own sandbox to confirm the real integration works end-to-end:
#!/usr/bin/env ruby
# frozen_string_literal: true
require_relative 'load_monitor'
require 'tmpdir'
require 'fileutils'
$failures = 0
def check(desc, cond)
  if cond
    puts "  ok - #{desc}"
  else
    puts "  FAIL - #{desc}"
    $failures += 1
  end
end
puts 'Test 1: read_loadavg parses the real /proc/loadavg format'
Dir.mktmpdir do |dir|
  File.write(File.join(dir, 'loadavg'), "0.38 0.26 0.11 1/167 1234\n")
  monitor = LoadMonitor.new(proc_path: dir, cpu_cores: 2)
  parsed = monitor.read_loadavg
  check('load1 == 0.38', parsed[:load1] == 0.38)
  check('load5 == 0.26', parsed[:load5] == 0.26)
  check('load15 == 0.11', parsed[:load15] == 0.11)
  check('running == 1', parsed[:running] == 1)
  check('total == 167', parsed[:total] == 167)
end
puts "\nTest 2: parse_cpu_line parses the aggregate 'cpu' line from /proc/stat"
stat_text = <<~STAT
  cpu  1956 1448 1085 35103 436 0 70 0 0 0
  cpu0 943 722 511 17659 165 0 64 0 0 0
  intr 122229 0
STAT
parsed = LoadMonitor.parse_cpu_line(stat_text)
check('user == 1956', parsed[:user] == 1956)
check('idle == 35103', parsed[:idle] == 35103)
check('does not pick up the per-core cpu0 line', parsed[:user] != 943)
puts "\nTest 3: cpu_percent_between computes correct utilization from two samples"
before = { user: 1000, nice: 0, system: 500, idle: 8000, iowait: 100, irq: 0, softirq: 0, steal: 0, guest: 0, guest_nice: 0 }
# simulate 1 second passing with the CPU 50% busy: idle grows by 50, busy grows by 50
after = { user: 1030, nice: 0, system: 520, idle: 8050, iowait: 100, irq: 0, softirq: 0, steal: 0, guest: 0, guest_nice: 0 }
pct = LoadMonitor.cpu_percent_between(before, after)
check('utilization is 50.0%', pct == 50.0)
puts "\nTest 4: cpu_percent_between handles a fully idle interval (0%)"
before2 = { user: 100, nice: 0, system: 50, idle: 9000, iowait: 0, irq: 0, softirq: 0, steal: 0, guest: 0, guest_nice: 0 }
after2 = { user: 100, nice: 0, system: 50, idle: 9100, iowait: 0, irq: 0, softirq: 0, steal: 0, guest: 0, guest_nice: 0 }
check('0% utilization when only idle grows', LoadMonitor.cpu_percent_between(before2, after2) == 0.0)
puts "\nTest 5: build_snapshot classifies status correctly against thresholds"
monitor = LoadMonitor.new(cpu_cores: 4)
snap = monitor.build_snapshot(loadavg: { load1: 1.0, load5: 1.0, load15: 1.0, running: 2, total: 100 }, cpu_percent: 30.0)
check('load 1.0 on 4 cores => load_per_core 0.25 => :ok', snap.status == :ok)
snap = monitor.build_snapshot(loadavg: { load1: 3.2, load5: 3.0, load15: 2.5, running: 5, total: 100 }, cpu_percent: 40.0)
check('load 3.2 on 4 cores => load_per_core 0.8 => :warning', snap.status == :warning && snap.load_per_core == 0.8)
snap = monitor.build_snapshot(loadavg: { load1: 5.0, load5: 4.0, load15: 3.0, running: 10, total: 100 }, cpu_percent: 50.0)
check('load 5.0 on 4 cores => load_per_core 1.25 => :critical', snap.status == :critical)
snap = monitor.build_snapshot(loadavg: { load1: 0.1, load5: 0.1, load15: 0.1, running: 1, total: 100 }, cpu_percent: 97.0)
check('cpu 97% alone escalates to :critical even with low load', snap.status == :critical)
check('reasons array explains why', snap.reasons.any? { |r| r.include?('cpu') })
puts "\nTest 6: format_report renders a readable summary"
report = monitor.format_report(snap)
check('report includes STATUS line', report.include?('Status'))
check('report includes CPU utilization', report.include?('CPU utilization'))
puts "\nTest 7: live end-to-end sample against this sandbox's real /proc"
live_monitor = LoadMonitor.new
live_snapshot = live_monitor.sample(interval: 0.3)
check('cpu_cores detected > 0', live_snapshot.cpu_cores > 0)
check('cpu_percent is between 0 and 100', live_snapshot.cpu_percent >= 0.0 && live_snapshot.cpu_percent <= 100.0)
check('load1 is a non-negative float', live_snapshot.load1 >= 0.0)
check('status is one of the known symbols', %i[ok warning critical].include?(live_snapshot.status))
puts "  (live sample: #{live_monitor.format_report(live_snapshot).gsub("\n", ' | ')})"
puts "\n#{$failures.zero? ? 'ALL TESTS PASSED' : "#{$failures} TEST(S) FAILED"}"
exit($failures.zero? ? 0 : 1)
Output from running this suite (including a live sample against a real, running Linux system):
Example Output
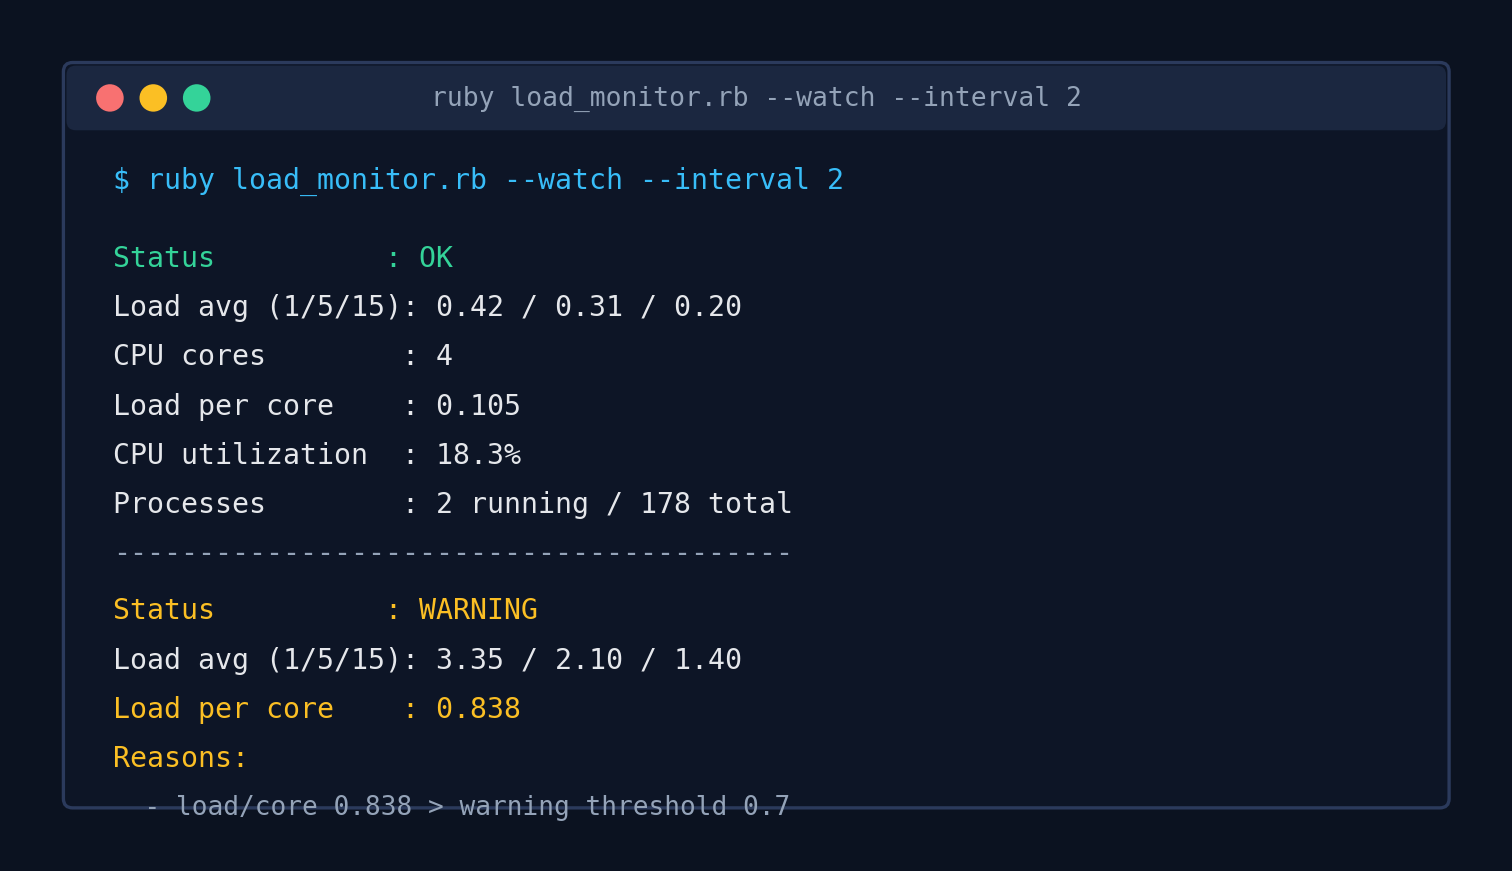
Running the actual CLI live with --watch mode, sampling every 2 seconds:
Troubleshooting
- CPU percent always reads 0% — make sure
intervalis at least a few hundred milliseconds; on a very short interval, jiffie counters (typically updated at 100Hz) may not have changed enough between samples to produce a meaningful delta. - Load average looks fine but the box “feels” slow — load average includes processes in uninterruptible sleep (usually waiting on disk I/O), which can spike load without spiking CPU%. Check
cpu_percentalongsideiowaitspecifically if you suspect a storage bottleneck. - Wrong number of CPU cores detected in a container —
Etc.nprocessorsreads the host’s CPU count via the kernel, which inside a cgroup-limited container may not match the container’s actual CPU quota. If you’re running this inside Docker/Kubernetes with CPU limits, passcpu_cores:explicitly based on the configured limit instead of relying on auto-detection. - Script exits immediately without
--watch— that’s intentional: without--watchit takes one sample and exits with a status code (0/1/2), which is what you want for a cron job or systemd timer. Add--watchfor continuous monitoring in a terminal.
Extending the Script
- Add per-core breakdown by parsing the individual
cpu0,cpu1, … lines from/proc/stat, useful for spotting a single hot core versus balanced load. - Add memory pressure checks from
/proc/meminfo(MemAvailablevs. total) alongside CPU/load for a fuller picture. - Wire
:criticalresults into a webhook (Slack, PagerDuty, an SNMP trap) instead of just a non-zero exit code. - Track snapshots over time (append to a CSV or send to a time-series database) to graph trends instead of only alerting on point-in-time thresholds.