require 'csv' and require 'time'.Enumerable methods.EXTEND — Lograge → CSV → analyzer cron
Part of our Ruby for DevOps series — practical Ruby scripts that solve real system-administration problems.
The Problem
Every DevOps and SRE team eventually ends up staring at a CSV of request logs trying to answer three questions: which endpoints are actually slow, what’s the error rate, and did something change recently that looks like the start of an incident. Reaching for a full data-analysis stack (pandas via a Python sidecar, or a gem like Daru) is often overkill for a one-off log analysis or a quick script that runs after a deploy.
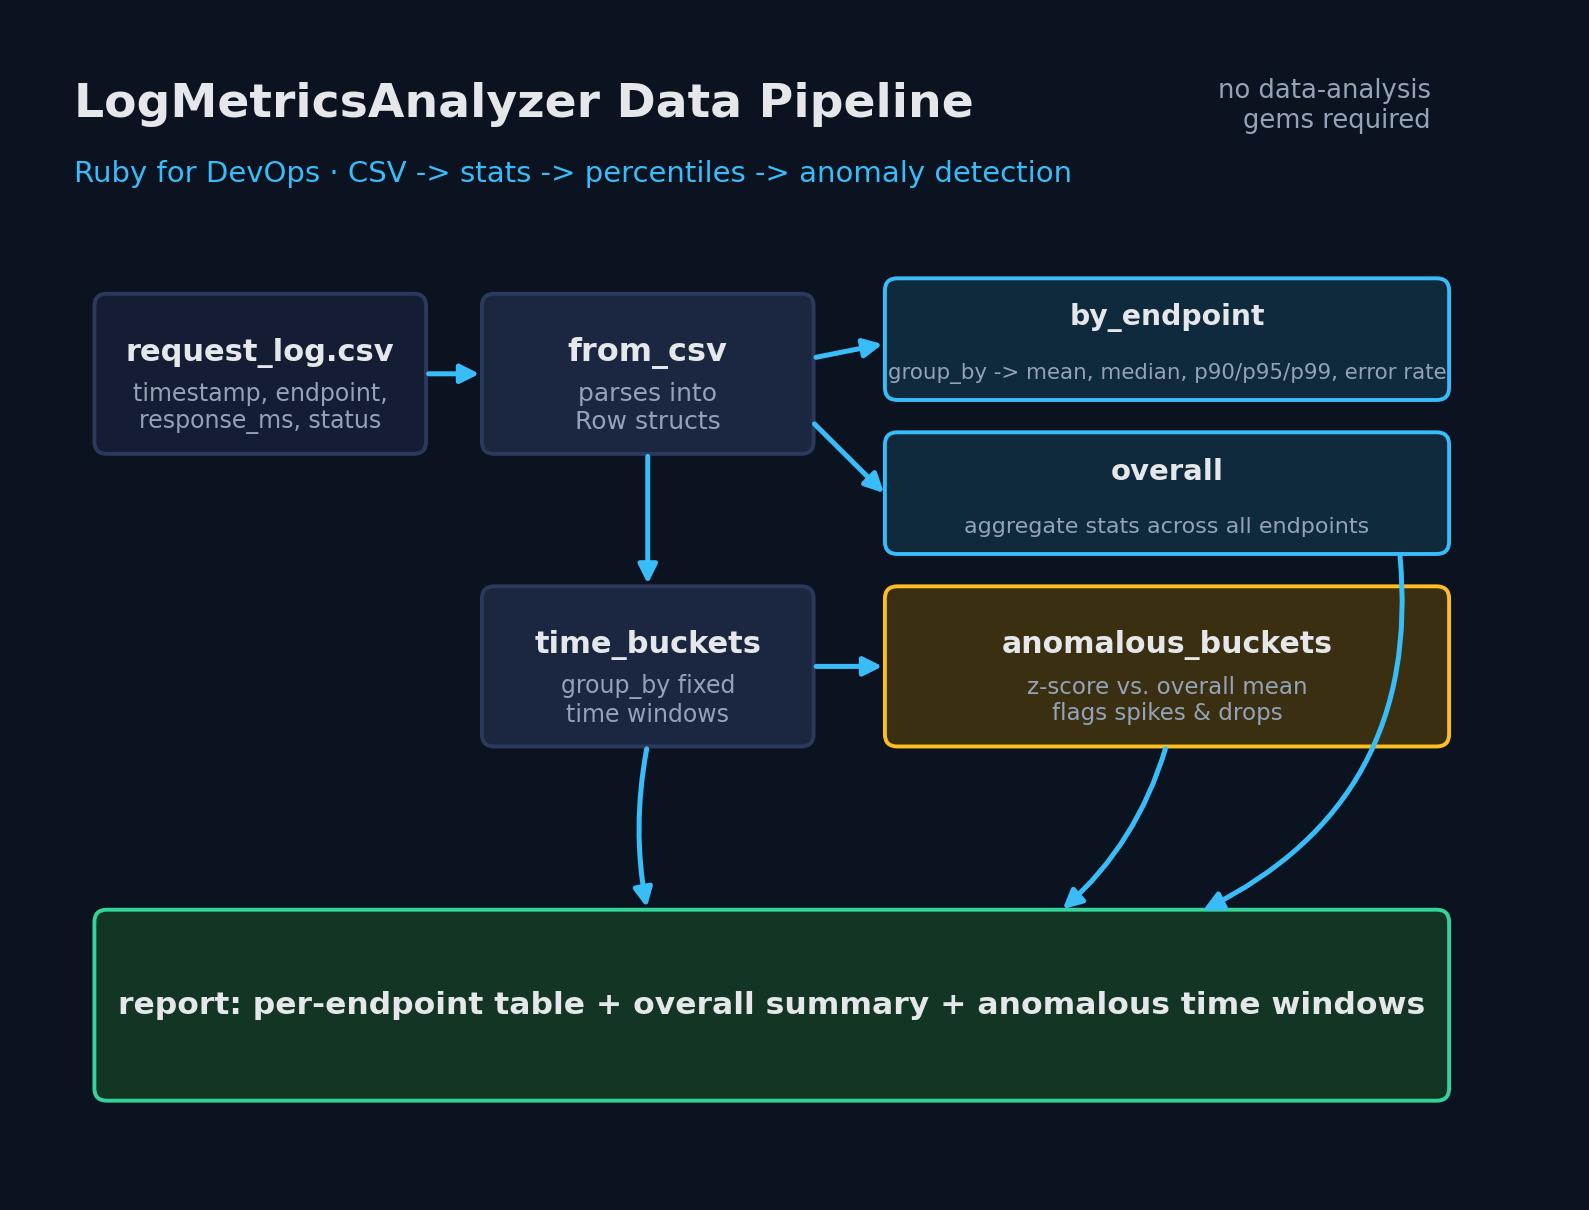
This tutorial shows how to do real data analysis in pure Ruby — descriptive statistics, percentiles, grouping/aggregation, and time-series anomaly detection — using nothing but the standard library. The techniques here (mean, percentile-by-interpolation, z-score anomaly detection) are exactly what a data-analysis gem does internally, so this also doubles as a look under the hood of tools like Daru or Numo, in case you ever need to reach for something similar without adding a dependency.
Prerequisites
- Ruby 2.7 or later (only standard library:
csv,time— no data-analysis gems) - A CSV of request logs with columns:
timestamp,endpoint,response_time_ms,status_code(this is a common shape for access logs exported from an app server or load balancer; adapt the column names to your own log format)
The Code
Save this as log_metrics_analyzer.rb:
#!/usr/bin/env ruby
# frozen_string_literal: true
# log_metrics_analyzer.rb
#
# Data analysis in Ruby, applied to a problem every DevOps/SRE team has:
# a CSV of request logs (timestamp, endpoint, response_time_ms, status_code)
# that needs to become an actual answer -- which endpoints are slow, what's
# the error rate, and did anything change in the last hour that looks like
# an incident starting.
#
# No external data-analysis gems (no Daru, no Numo) -- just Ruby's standard
# library (csv, time, set). The goal is to show the core techniques
# (descriptive stats, percentiles, grouping/aggregation, time-bucketing,
# z-score anomaly detection) so you understand what a gem like Daru would
# be doing for you under the hood, and can do it dependency-free when a
# full data-analysis stack is overkill for a one-off log analysis.
require 'csv'
require 'time'
class LogMetricsAnalyzer
  Row = Struct.new(:time, :endpoint, :response_ms, :status, keyword_init: true)
  # z-score threshold beyond which a time bucket's average latency is
  # flagged as anomalous relative to the overall mean.
  DEFAULT_ANOMALY_Z = 2.0
  def initialize(rows)
    @rows = rows
  end
  # Loads and parses a CSV file with columns: timestamp,endpoint,response_time_ms,status_code
  def self.from_csv(path)
    rows = []
    CSV.foreach(path, headers: true) do |csv_row|
      rows << Row.new(
        time: Time.parse(csv_row['timestamp']),
        endpoint: csv_row['endpoint'],
        response_ms: Float(csv_row['response_time_ms']),
        status: Integer(csv_row['status_code'])
      )
    end
    new(rows)
  end
  # ---- descriptive statistics (pure functions over arrays of numbers) ----
  def self.mean(values)
    return 0.0 if values.empty?
    values.sum.to_f / values.size
  end
  def self.median(values)
    percentile(values, 50)
  end
  def self.variance(values)
    return 0.0 if values.size < 2
    m = mean(values)
    values.sum { |v| (v - m)**2 } / (values.size - 1)
  end
  def self.stddev(values)
    Math.sqrt(variance(values))
  end
  # Linear-interpolation percentile (same method used by numpy's default
  # and most stats libraries), so a p95 of 250ms means 95% of requests
  # were at or below 250ms.
  def self.percentile(values, pct)
    return 0.0 if values.empty?
    sorted = values.sort
    return sorted.first if sorted.size == 1
    rank = (pct / 100.0) * (sorted.size - 1)
    lower = rank.floor
    upper = rank.ceil
    return sorted[lower] if lower == upper
    weight = rank - lower
    sorted[lower] + (sorted[upper] - sorted[lower]) * weight
  end
  # ---- per-endpoint summary ----
  def by_endpoint
    grouped = @rows.group_by(&:endpoint)
    grouped.transform_values do |rows|
      latencies = rows.map(&:response_ms)
      errors = rows.count { |r| r.status >= 400 }
      {
        count: rows.size,
        mean_ms: self.class.mean(latencies).round(2),
        median_ms: self.class.median(latencies).round(2),
        p90_ms: self.class.percentile(latencies, 90).round(2),
        p95_ms: self.class.percentile(latencies, 95).round(2),
        p99_ms: self.class.percentile(latencies, 99).round(2),
        max_ms: latencies.max.round(2),
        error_count: errors,
        error_rate_pct: rows.empty? ? 0.0 : (100.0 * errors / rows.size).round(2)
      }
    end
  end
  # ---- overall summary across all endpoints ----
  def overall
    latencies = @rows.map(&:response_ms)
    errors = @rows.count { |r| r.status >= 400 }
    {
      total_requests: @rows.size,
      mean_ms: self.class.mean(latencies).round(2),
      p95_ms: self.class.percentile(latencies, 95).round(2),
      p99_ms: self.class.percentile(latencies, 99).round(2),
      error_rate_pct: @rows.empty? ? 0.0 : (100.0 * errors / @rows.size).round(2)
    }
  end
  # ---- time-bucketed trend + anomaly detection ----
  # Groups rows into fixed-size time buckets (default 60s) and computes
  # mean latency per bucket. Returns buckets in chronological order.
  def time_buckets(bucket_seconds: 60)
    return [] if @rows.empty?
    grouped = @rows.group_by { |r| (r.time.to_i / bucket_seconds) * bucket_seconds }
    grouped.keys.sort.map do |bucket_start|
      rows = grouped[bucket_start]
      latencies = rows.map(&:response_ms)
      {
        bucket_start: Time.at(bucket_start),
        count: rows.size,
        mean_ms: self.class.mean(latencies).round(2)
      }
    end
  end
  # Flags time buckets whose mean latency is more than `z` standard
  # deviations from the overall mean latency -- a simple but effective way
  # to catch "something changed" without hand-tuned thresholds.
  def anomalous_buckets(bucket_seconds: 60, z: DEFAULT_ANOMALY_Z)
    buckets = time_buckets(bucket_seconds: bucket_seconds)
    return [] if buckets.size < 2
    means = buckets.map { |b| b[:mean_ms] }
    overall_mean = self.class.mean(means)
    overall_stddev = self.class.stddev(means)
    return [] if overall_stddev.zero?
    buckets.each_with_object([]) do |bucket, anomalies|
      score = (bucket[:mean_ms] - overall_mean) / overall_stddev
      if score.abs >= z
        anomalies << bucket.merge(z_score: score.round(2),
                                   direction: score.positive? ? :spike : :drop)
      end
    end
  end
end
# ---------------------------------------------------------------------------
# CLI
# ---------------------------------------------------------------------------
if __FILE__ == $PROGRAM_NAME
  path = ARGV[0]
  unless path && File.exist?(path)
    warn "Usage: #{$PROGRAM_NAME} <path-to-log.csv> [--bucket-seconds N]"
    exit 1
  end
  bucket_seconds = 60
  if (idx = ARGV.index('--bucket-seconds'))
    bucket_seconds = ARGV[idx + 1].to_i
  end
  analyzer = LogMetricsAnalyzer.from_csv(path)
  overall = analyzer.overall
  puts '=== Overall ==='
  puts "Total requests : #{overall[:total_requests]}"
  puts "Mean latency   : #{overall[:mean_ms]} ms"
  puts "p95 latency    : #{overall[:p95_ms]} ms"
  puts "p99 latency    : #{overall[:p99_ms]} ms"
  puts "Error rate     : #{overall[:error_rate_pct]}%"
  puts "\n=== By Endpoint ==="
  analyzer.by_endpoint.sort_by { |_, stats| -stats[:p95_ms] }.each do |endpoint, stats|
    puts "#{endpoint}"
    puts "  requests=#{stats[:count]} mean=#{stats[:mean_ms]}ms p95=#{stats[:p95_ms]}ms " \
         "p99=#{stats[:p99_ms]}ms errors=#{stats[:error_count]} (#{stats[:error_rate_pct]}%)"
  end
  anomalies = analyzer.anomalous_buckets(bucket_seconds: bucket_seconds)
  puts "\n=== Anomalous Time Buckets (bucket=#{bucket_seconds}s) ==="
  if anomalies.empty?
    puts 'None detected.'
  else
    anomalies.each do |a|
      puts "#{a[:bucket_start].getutc.strftime('%H:%M:%S')} UTC -- mean #{a[:mean_ms]}ms " \
           "(z=#{a[:z_score]}, #{a[:direction]}, n=#{a[:count]})"
    end
  end
end
Step-by-Step Walkthrough
Descriptive statistics as pure functions
mean, median, variance, and stddev are implemented as class methods that take a plain array of numbers and return a number — no state, no side effects. percentile uses linear interpolation between the two nearest ranks (the same default method used by NumPy and most statistics libraries), so a p95 of 250ms means 95% of requests completed at or below 250ms, not just “the value at index 0.95 * length” with no interpolation.
Grouping and aggregating with by_endpoint
by_endpoint uses Ruby’s built-in group_by to bucket rows by endpoint, then maps each group into a stats hash (count, mean, median, p90/p95/p99, max, and error rate — anything with a status_code >= 400 counts as an error). This is the same shape of operation as a GROUP BY in SQL or a pandas groupby, done with plain Ruby Enumerable methods.
Time-bucketing for trend analysis
time_buckets groups rows into fixed-size time windows (default 60 seconds) by integer-dividing each row’s Unix timestamp by the bucket size, then computes the mean latency per bucket. This turns a stream of individual request timestamps into a regular time series you can analyze for trends or anomalies.
Anomaly detection with z-scores
anomalous_buckets computes a z-score for each time bucket’s mean latency — how many standard deviations it is from the overall mean across all buckets — and flags anything beyond a threshold (default 2.0). This is a simple, well-understood technique: no machine learning model, no hand-tuned static thresholds per endpoint, just “is this bucket unusual compared to the rest of the window.” It correctly returns no anomalies when every bucket is identical (zero standard deviation would otherwise cause a division-by-zero, which the code guards against explicitly).
Loading real data with from_csv
from_csv uses Ruby’s standard library CSV.foreach with headers: true so each row can be accessed by column name, then converts each row into a Row struct with proper types (Time.parse for the timestamp, Float for latency, Integer for the status code) rather than leaving everything as strings.
Testing It
Every statistical function is a pure function over plain arrays or a small in-memory list of Row structs, so the whole analysis pipeline — grouping, percentiles, time-bucketing, and anomaly detection — is fully testable without needing a real log file, a database, or any external service:
#!/usr/bin/env ruby
# frozen_string_literal: true
require_relative 'log_metrics_analyzer'
require 'tmpdir'
require 'time'
$failures = 0
def check(desc, cond)
  if cond
    puts "  ok - #{desc}"
  else
    puts "  FAIL - #{desc}"
    $failures += 1
  end
end
puts 'Test 1: mean/median/percentile on known values'
values = [10, 20, 30, 40, 50]
check('mean is 30.0', LogMetricsAnalyzer.mean(values) == 30.0)
check('median is 30.0', LogMetricsAnalyzer.median(values) == 30.0)
check('p90 is close to 46.0', (LogMetricsAnalyzer.percentile(values, 90) - 46.0).abs < 0.001)
check('percentile of empty array is 0.0', LogMetricsAnalyzer.percentile([], 95) == 0.0)
check('percentile of single value returns that value', LogMetricsAnalyzer.percentile([42], 50) == 42)
puts "\nTest 2: variance/stddev on known values"
# values [2, 4, 4, 4, 5, 5, 7, 9] have a well-known sample stddev of 2.13809...
sample = [2, 4, 4, 4, 5, 5, 7, 9]
check('stddev matches known value ~2.138', (LogMetricsAnalyzer.stddev(sample) - 2.13809).abs < 0.001)
check('variance of a single value is 0.0', LogMetricsAnalyzer.variance([5]) == 0.0)
puts "\nTest 3: by_endpoint groups and computes stats correctly"
rows = [
  LogMetricsAnalyzer::Row.new(time: Time.parse('2026-07-22T10:00:00Z'), endpoint: '/api/users', response_ms: 100.0, status: 200),
  LogMetricsAnalyzer::Row.new(time: Time.parse('2026-07-22T10:00:05Z'), endpoint: '/api/users', response_ms: 200.0, status: 200),
  LogMetricsAnalyzer::Row.new(time: Time.parse('2026-07-22T10:00:10Z'), endpoint: '/api/users', response_ms: 300.0, status: 500),
  LogMetricsAnalyzer::Row.new(time: Time.parse('2026-07-22T10:00:15Z'), endpoint: '/api/orders', response_ms: 50.0, status: 200)
]
analyzer = LogMetricsAnalyzer.new(rows)
stats = analyzer.by_endpoint
check('finds 2 distinct endpoints', stats.keys.sort == ['/api/orders', '/api/users'])
check('/api/users has 3 requests', stats['/api/users'][:count] == 3)
check('/api/users mean is 200.0', stats['/api/users'][:mean_ms] == 200.0)
check('/api/users has 1 error (33.33%)', stats['/api/users'][:error_count] == 1 && stats['/api/users'][:error_rate_pct] == 33.33)
check('/api/orders has 0 errors', stats['/api/orders'][:error_count] == 0)
puts "\nTest 4: overall summary aggregates across all endpoints"
overall = analyzer.overall
check('total_requests is 4', overall[:total_requests] == 4)
check('error_rate_pct is 25.0', overall[:error_rate_pct] == 25.0)
puts "\nTest 5: time_buckets groups rows by fixed-size time windows"
rows2 = (0...10).map do |i|
  # first 5 requests in minute 0, next 5 in minute 1
  t = Time.parse('2026-07-22T10:00:00Z') + (i < 5 ? i * 5 : 60 + (i - 5) * 5)
  LogMetricsAnalyzer::Row.new(time: t, endpoint: '/api/ping', response_ms: 50.0, status: 200)
end
analyzer2 = LogMetricsAnalyzer.new(rows2)
buckets = analyzer2.time_buckets(bucket_seconds: 60)
check('produces 2 buckets', buckets.size == 2)
check('each bucket has 5 requests', buckets.all? { |b| b[:count] == 5 })
puts "\nTest 6: anomalous_buckets flags a latency spike via z-score"
normal_rows = (0...20).map do |i|
  LogMetricsAnalyzer::Row.new(
    time: Time.parse('2026-07-22T10:00:00Z') + i * 60,
    endpoint: '/api/ping',
    response_ms: 100.0 + (i.even? ? 2 : -2), # tight, stable latency around 100ms
    status: 200
  )
end
spike_row_time = Time.parse('2026-07-22T10:00:00Z') + 20 * 60
spike_rows = 5.times.map do |i|
  LogMetricsAnalyzer::Row.new(time: spike_row_time + i, endpoint: '/api/ping', response_ms: 5000.0, status: 200)
end
analyzer3 = LogMetricsAnalyzer.new(normal_rows + spike_rows)
anomalies = analyzer3.anomalous_buckets(bucket_seconds: 60, z: 2.0)
check('detects at least one anomalous bucket', anomalies.size >= 1)
check('flagged anomaly is a spike (high latency)', anomalies.any? { |a| a[:direction] == :spike })
check('no anomalies when stddev is 0 (all buckets identical)',
      LogMetricsAnalyzer.new(rows2).anomalous_buckets(bucket_seconds: 60).empty?)
puts "\nTest 7: from_csv reads and parses a real CSV file end-to-end"
Dir.mktmpdir do |dir|
  csv_path = File.join(dir, 'sample.csv')
  File.write(csv_path, <<~CSV)
    timestamp,endpoint,response_time_ms,status_code
    2026-07-22T10:00:00Z,/api/users,120,200
    2026-07-22T10:00:01Z,/api/users,450,200
    2026-07-22T10:00:02Z,/api/orders,90,200
    2026-07-22T10:00:03Z,/api/orders,5200,500
  CSV
  loaded = LogMetricsAnalyzer.from_csv(csv_path)
  overall = loaded.overall
  check('parses all 4 rows from CSV', overall[:total_requests] == 4)
  check('correctly parses one 500 status as an error', overall[:error_rate_pct] == 25.0)
  by_ep = loaded.by_endpoint
  check('/api/orders p99 reflects the 5200ms outlier', by_ep['/api/orders'][:p99_ms] > 5000)
end
puts "\n#{$failures.zero? ? 'ALL TESTS PASSED' : "#{$failures} TEST(S) FAILED"}"
exit($failures.zero? ? 0 : 1)
Output from running this suite:
Example Output
Running the CLI against a generated sample of 500 requests across four endpoints, with a deliberately injected latency spike on /api/checkout between minutes 15–17:
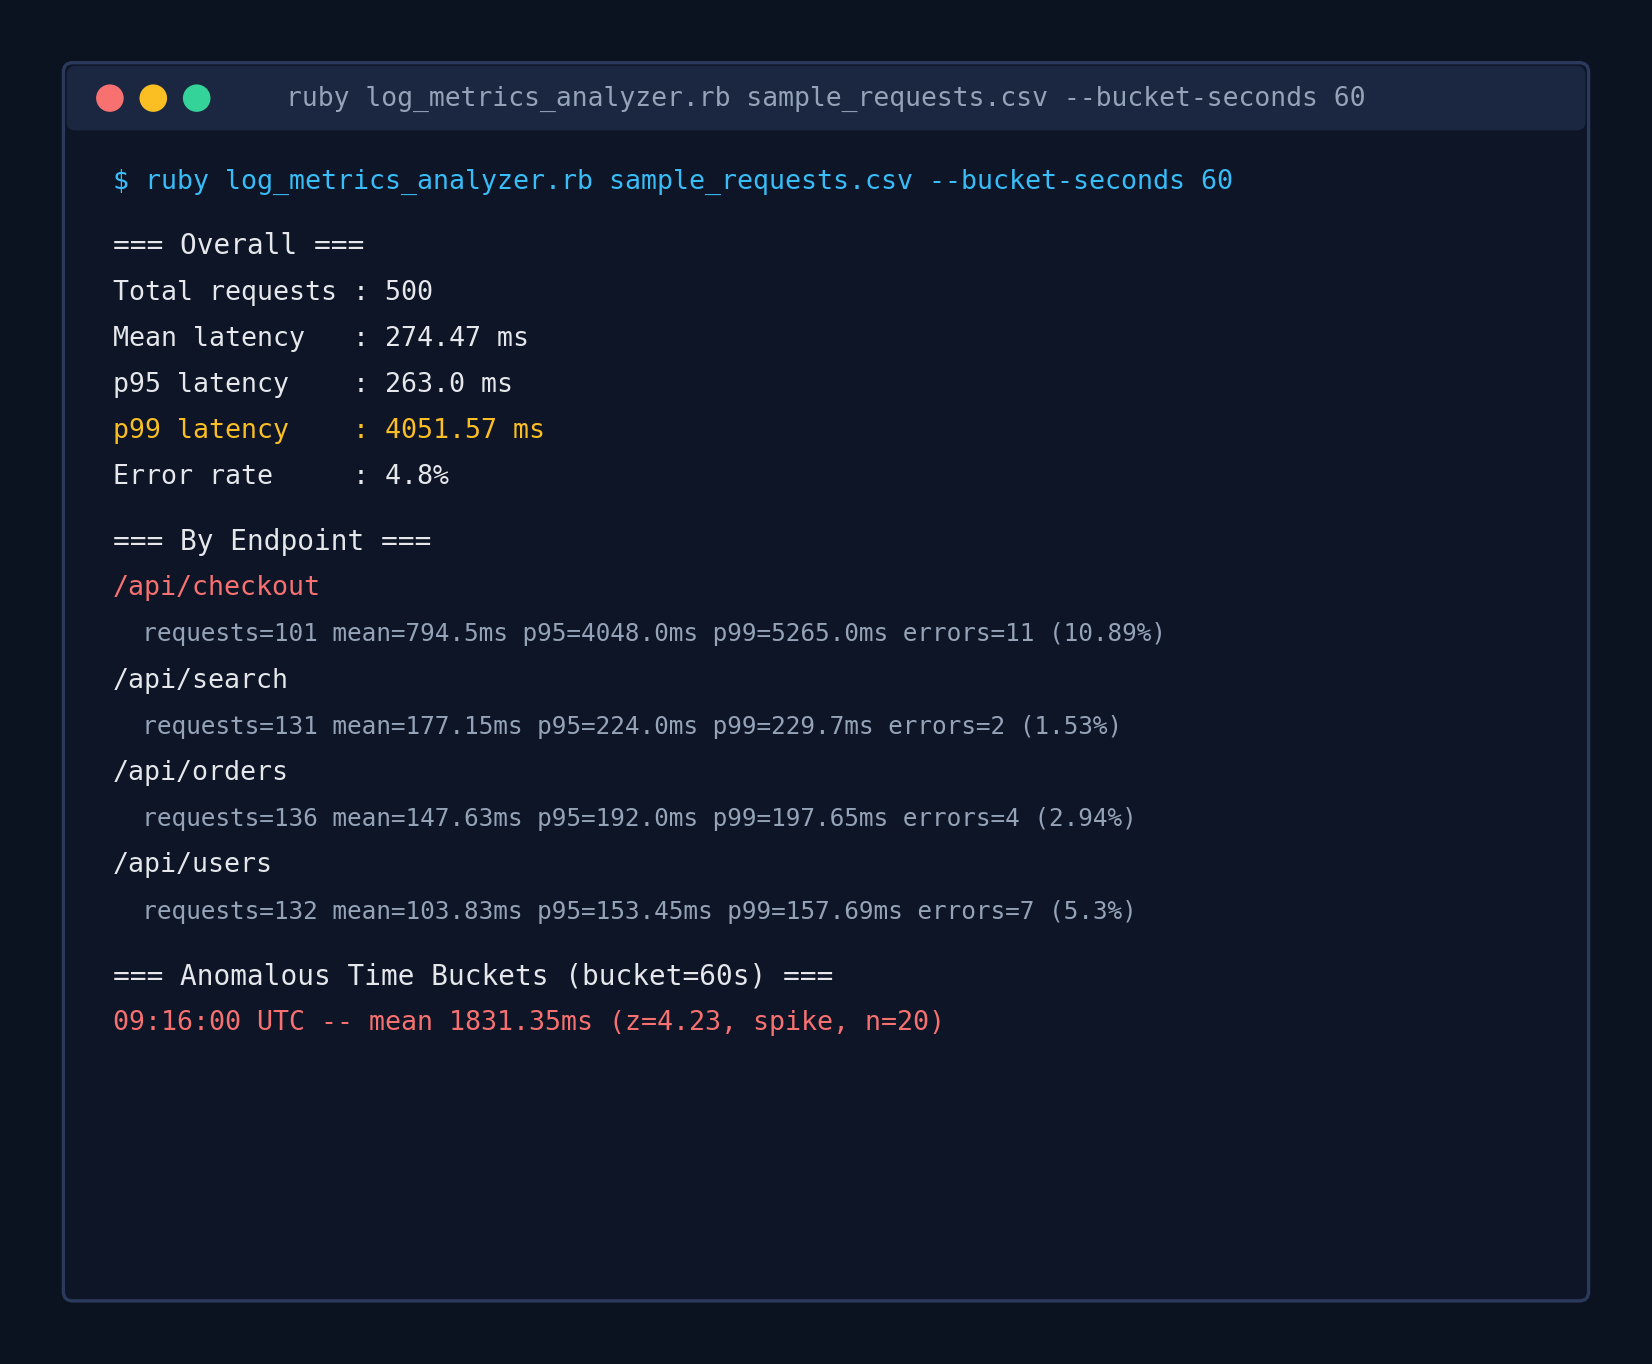
The anomaly detector correctly isolated the exact minute where /api/checkout‘s injected slowdown pushed the overall bucket mean far enough from baseline to cross the z-score threshold — without ever being told which endpoint or time window to look at.
Troubleshooting
- Percentiles look wrong compared to another tool — there are several valid percentile interpolation methods (nearest-rank, linear interpolation, etc.), and different tools default to different ones. This script uses linear interpolation between ranks; if you’re cross-checking against a tool using nearest-rank, small differences are expected and not a bug.
ArgumentErrorfromTime.parseorFloat()/Integer()infrom_csv— your CSV has a malformed row (bad timestamp format, non-numeric latency, or a non-integer status code). Add abegin/rescuearound the row-building block if you’d rather skip bad rows and log a warning than fail the whole run.- No anomalies detected even though you know there was an incident — check your
bucket_secondssize relative to how long the incident lasted and how many requests happened per bucket. A very short incident spread across a large bucket size can get diluted by normal traffic in the same window; try a smaller bucket size. - Every bucket gets flagged as anomalous — this usually means your baseline traffic is naturally bursty (few requests per bucket with high variance), which inflates the z-score sensitivity. Consider using a minimum sample size per bucket before considering it for anomaly detection, or widening the bucket window.
Extending the Script
- Add a rolling/moving average alongside the raw per-bucket mean to smooth out noise before anomaly detection.
- Export the per-endpoint and per-bucket stats to CSV or JSON so they can feed a dashboard or be diffed day-over-day.
- Add percentile-based anomaly detection (flagging when p95/p99 — not just the mean — deviates sharply) to catch tail-latency regressions that a mean-based check might miss.
- Wire
anomalous_bucketsinto a Slack or PagerDuty webhook so a detected spike pages someone automatically instead of waiting for a post-incident CSV pull. - Support streaming input (reading from STDIN line-by-line) instead of loading the whole CSV into memory, for analyzing very large log files.