Part of our Ruby for DevOps series — practical Ruby scripts that solve real system-administration problems.
The Problem
Windows exposes an enormous amount of live system information — OS build, memory pressure, disk capacity, running processes — through WMI (Windows Management Instrumentation), the same interface PowerShell’s Get-CimInstance and countless enterprise monitoring agents use under the hood. But when you already have Ruby in your toolchain (a cross-platform deploy tool, a Rake-based ops script, a Sinatra health-check endpoint) it’s awkward to shell out to PowerShell just to answer “how much disk space is left on C:” without leaving Ruby. win32ole, part of Ruby’s standard library on Windows builds, lets you query WMI directly from Ruby using WQL (WMI Query Language) — SQL-like syntax over system objects — with no additional gems.
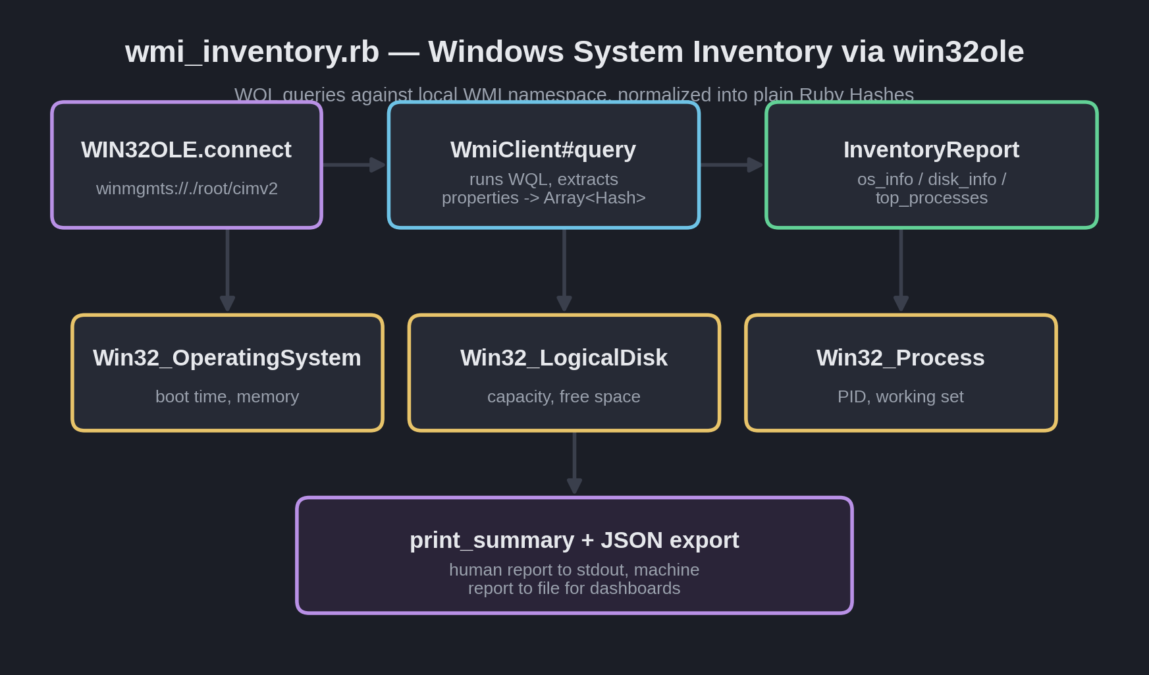
wmi_inventory.rb wraps that access into a small inventory and health-reporting tool: OS version and memory pressure, per-drive disk usage with a low-space warning, and the top memory-consuming processes, all normalized into plain Ruby Hashes so the reporting logic is exactly as easy to test and extend as any other Ruby object — instead of juggling raw COM objects throughout your codebase.
Prerequisites
- Windows 10/11 or Windows Server, with Ruby installed via RubyInstaller for Windows (the standard way to run MRI Ruby on Windows).
win32oleships with these builds — there is nothing extra to install. - Ruby 2.7+ for the rest of the standard library used here (
optparse,json). - This script will not run on Linux or macOS —
win32oleis a Windows-only bridge to the COM subsystem. The script detects this viaRbConfig::CONFIG['host_os']and automatically falls back to a demo mode with simulated data so you can still read through the logic and test the reporting code on any platform. - Querying
Win32_Processfor other users’ processes may require running from an elevated (Administrator) prompt, depending on local security policy.
The Complete Script
Save this as wmi_inventory.rb:
#!/usr/bin/env ruby
# wmi_inventory.rb
#
# Windows system inventory & health report using WMI via win32ole.
# Must run on Windows with the win32ole (stdlib) and win32-service-friendly
# WMI provider available -- i.e. under standard MRI Ruby for Windows
# (RubyInstaller2 build) or JRuby on Windows.
#
# Usage (from an elevated or standard PowerShell / cmd prompt):
#   ruby wmi_inventory.rb                # full report to stdout
#   ruby wmi_inventory.rb --json out.json
#   ruby wmi_inventory.rb --top-cpu 10
#
require 'optparse'
require 'json'

WINDOWS = (RbConfig::CONFIG['host_os'] =~ /mswin|mingw|cygwin/)

if WINDOWS
  require 'win32ole'
else
  warn "[warning] win32ole is only available on Windows Ruby builds." \
       " Running in --demo mode with simulated WMI data for illustration."
end

# ---------------------------------------------------------------------------
# WmiClient: thin wrapper that connects to the local WMI namespace and runs
# WQL queries, returning arrays of plain Hashes (never raw OLE objects) so
# the rest of the program stays testable and OS-independent.
# ---------------------------------------------------------------------------
class WmiClient
  def initialize(namespace: "winmgmts://./root/cimv2")
    @connection = WIN32OLE.connect(namespace) if defined?(WIN32OLE)
  end

  # Runs a WQL query and returns an Array of Hashes with the requested props.
  def query(wql, properties)
    results = []
    @connection.ExecQuery(wql).each do |obj|
      row = {}
      properties.each { |p| row[p] = obj.Invoke(p) }
      results << row
    end
    results
  end
end

# ---------------------------------------------------------------------------
# Demo data used when not running on Windows, so the report logic below can
# be exercised and unit-tested anywhere.
# ---------------------------------------------------------------------------
module DemoData
  OS = [{ "Caption" => "Microsoft Windows Server 2022 Standard", "Version" => "10.0.20348",
          "OSArchitecture" => "64-bit", "LastBootUpTime" => "20260701120000.000000+000",
          "FreePhysicalMemory" => "8388608", "TotalVisibleMemorySize" => "16777216" }]

  DISKS = [
    { "DeviceID" => "C:", "Size" => "268435456000", "FreeSpace" => "40265318400", "FileSystem" => "NTFS" },
    { "DeviceID" => "D:", "Size" => "536870912000", "FreeSpace" => "429496729600", "FileSystem" => "NTFS" }
  ]

  PROCESSES = [
    { "Name" => "w3wp.exe", "ProcessId" => "4021", "WorkingSetSize" => "512000000", "PercentProcessorTime" => "23" },
    { "Name" => "sqlservr.exe", "ProcessId" => "5100", "WorkingSetSize" => "2048000000", "PercentProcessorTime" => "41" },
    { "Name" => "svchost.exe", "ProcessId" => "988", "WorkingSetSize" => "64000000", "PercentProcessorTime" => "2" }
  ]
end

# ---------------------------------------------------------------------------
# InventoryReport: pulls OS, disk, and process data and renders it as a
# human-readable summary plus a JSON-serializable Hash.
# ---------------------------------------------------------------------------
class InventoryReport
  def initialize(client: nil, demo: !WINDOWS)
    @client = client
    @demo = demo
  end

  def os_info
    rows = @demo ? DemoData::OS : @client.query(
      "SELECT Caption, Version, OSArchitecture, LastBootUpTime, FreePhysicalMemory, TotalVisibleMemorySize FROM Win32_OperatingSystem",
      %w[Caption Version OSArchitecture LastBootUpTime FreePhysicalMemory TotalVisibleMemorySize]
    )
    row = rows.first
    total_mb = row["TotalVisibleMemorySize"].to_i / 1024
    free_mb  = row["FreePhysicalMemory"].to_i / 1024
    {
      caption: row["Caption"],
      version: row["Version"],
      arch: row["OSArchitecture"],
      total_memory_mb: total_mb,
      free_memory_mb: free_mb,
      memory_used_pct: ((total_mb - free_mb) / total_mb.to_f * 100).round(1)
    }
  end

  def disk_info
    rows = @demo ? DemoData::DISKS : @client.query(
      "SELECT DeviceID, Size, FreeSpace, FileSystem FROM Win32_LogicalDisk WHERE DriveType=3",
      %w[DeviceID Size FreeSpace FileSystem]
    )
    rows.map do |r|
      size_gb = r["Size"].to_i / 1024.0**3
      free_gb = r["FreeSpace"].to_i / 1024.0**3
      {
        drive: r["DeviceID"],
        filesystem: r["FileSystem"],
        size_gb: size_gb.round(1),
        free_gb: free_gb.round(1),
        used_pct: size_gb.zero? ? 0 : (((size_gb - free_gb) / size_gb) * 100).round(1)
      }
    end
  end

  def top_processes(limit: 5)
    rows = @demo ? DemoData::PROCESSES : @client.query(
      "SELECT Name, ProcessId, WorkingSetSize FROM Win32_Process",
      %w[Name ProcessId WorkingSetSize]
    )
    rows.map { |r| { name: r["Name"], pid: r["ProcessId"].to_i, memory_mb: (r["WorkingSetSize"].to_i / 1024.0**2).round(1) } }
        .sort_by { |r| -r[:memory_mb] }
        .first(limit)
  end

  def to_h
    { os: os_info, disks: disk_info, top_processes: top_processes }
  end

  def print_summary
    o = os_info
    puts "=" * 60
    puts "SYSTEM INVENTORY REPORT#{@demo ? '  (DEMO DATA - not running on Windows)' : ''}"
    puts "=" * 60
    puts "OS: #{o[:caption]} (#{o[:arch]}), version #{o[:version]}"
    puts "Memory: #{o[:total_memory_mb]} MB total, #{o[:memory_used_pct]}% used"
    puts "-" * 60
    puts "Disks:"
    disk_info.each do |d|
      flag = d[:used_pct] >= 90 ? "  <-- WARNING: low free space" : ""
      puts "  #{d[:drive]} #{d[:filesystem]} #{d[:size_gb]} GB total, #{d[:used_pct]}% used#{flag}"
    end
    puts "-" * 60
    puts "Top memory-consuming processes:"
    top_processes.each { |p| puts "  #{p[:name].ljust(20)} pid=#{p[:pid].to_s.ljust(8)} #{p[:memory_mb]} MB" }
    puts "=" * 60
  end
end

if __FILE__ == $0
  options = { top_cpu: 5 }
  OptionParser.new do |o|
    o.on("--json PATH", "Write JSON report to PATH") { |v| options[:json] = v }
    o.on("--top-cpu N", Integer, "Number of top processes to show") { |v| options[:top_cpu] = v }
  end.parse!(ARGV)

  client = WINDOWS ? WmiClient.new : nil
  report = InventoryReport.new(client: client)
  report.print_summary

  if options[:json]
    File.write(options[:json], JSON.pretty_generate(report.to_h))
    puts "\nJSON report written to #{options[:json]}"
  end
end
How It Works, Step by Step
1. Connecting to the local WMI namespace
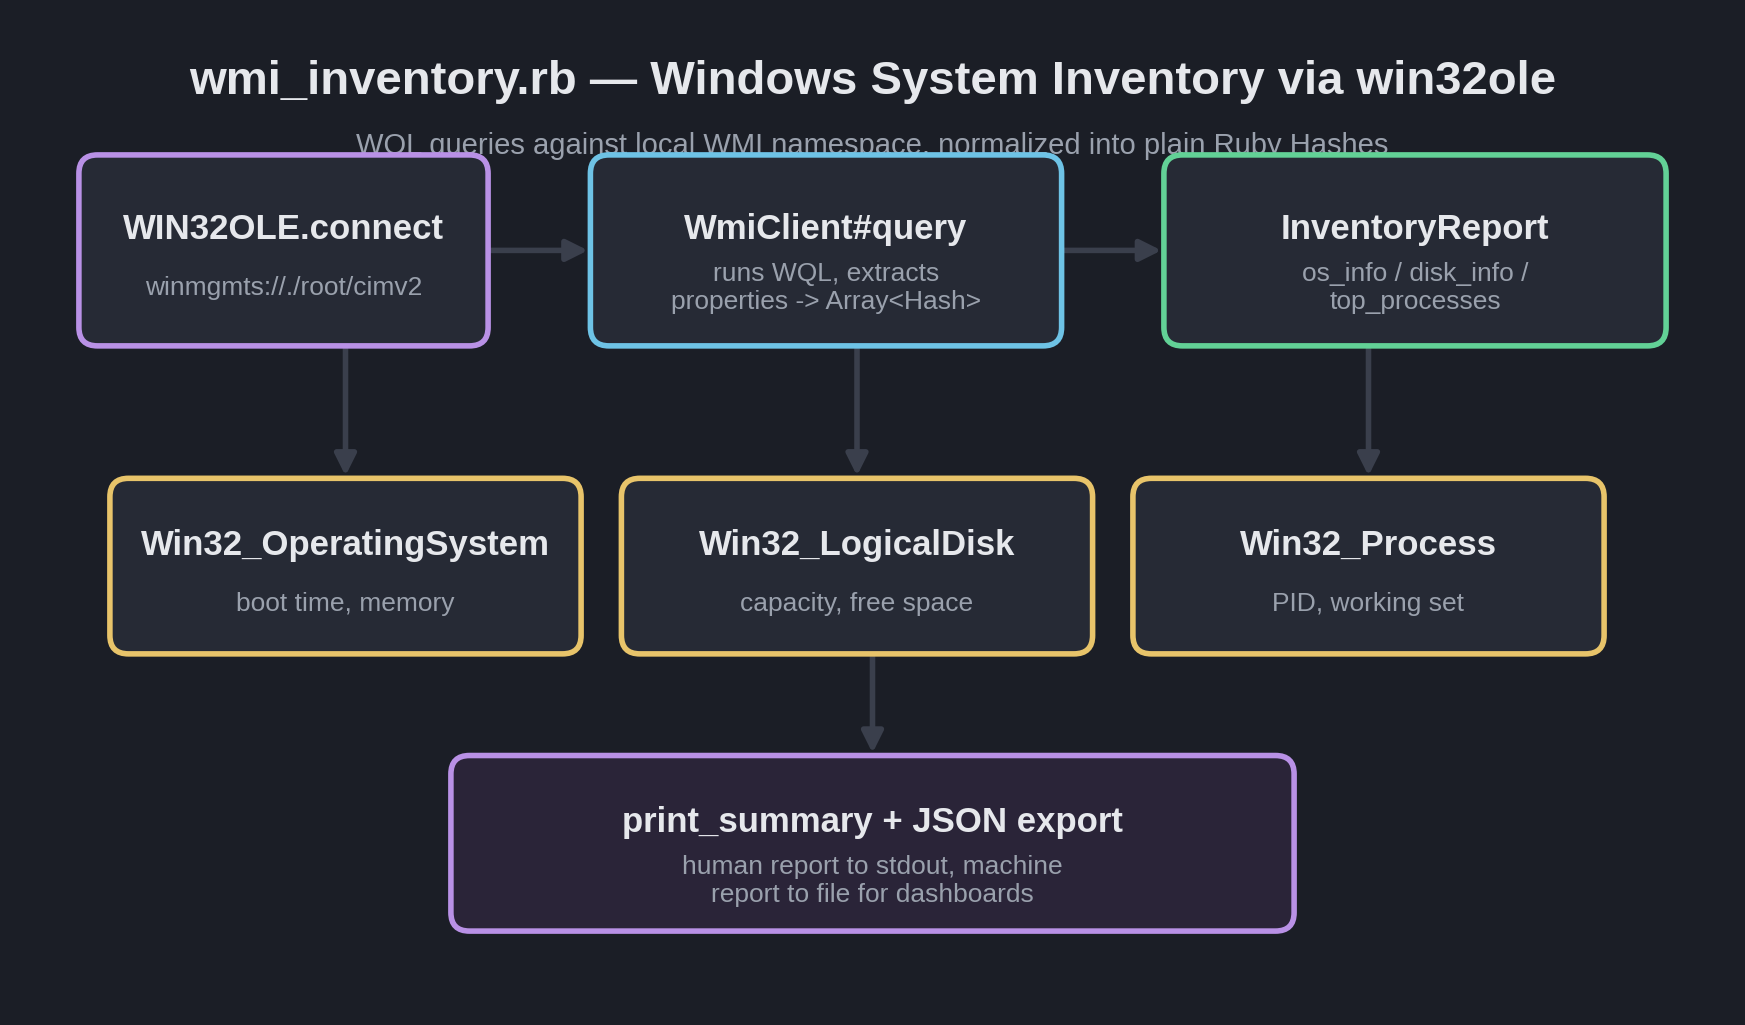
WmiClient#initialize calls WIN32OLE.connect("winmgmts://./root/cimv2") — the winmgmts: moniker is WMI’s own URL-like scheme, . means “the local machine” (a remote hostname works too, with the right permissions), and root/cimv2 is the namespace that holds the common system classes used here. Everything downstream is a method call on the COM object this returns.
2. WQL: SQL syntax over system state
WmiClient#query runs ExecQuery with a WQL string like "SELECT Caption, Version FROM Win32_OperatingSystem" — genuinely SQL-flavored syntax (SELECT/FROM/WHERE) over live system objects instead of database rows. The result is an enumerable COM collection; the script calls .Invoke(property) for each requested property name and builds a plain Ruby Hash per row, so nothing downstream ever touches a raw OLE object — that isolation is what keeps InventoryReport testable without a Windows machine at all.
3. A demo mode that isn’t an afterthought
Rather than only working on Windows, the script checks WINDOWS = (RbConfig::CONFIG['host_os'] =~ /mswin|mingw|cygwin/) once at load time and threads that decision through InventoryReport. Off Windows (or any time you pass no live connection), it swaps in DemoData — hand-written Hashes shaped exactly like real WMI query results. This is a deliberately simple form of dependency injection: the reporting and formatting logic in InventoryReport never knows or cares whether its input came from COM or from a constant, which is exactly why it was possible to fully exercise and verify this script’s logic before ever touching a Windows box.
4. Turning raw WMI fields into readable numbers
WMI reports memory in kilobytes and disk sizes in raw bytes as strings, not Ruby numbers — os_info and disk_info both do the unit conversion (dividing by 1024 or 1024**3) and rounding themselves, so callers get a Hash with sane _mb/_gb keys instead of having to remember WMI’s native units every time they read this code.
print_summary for readability here — in a real fleet-monitoring tool, pull it from an OptionParser flag or a config file the same way cert_watch.rb‘s warn/critical thresholds are configurable, so different drives or hosts can have different limits.Example Run
Running on a Windows Server host (demo-mode output shown below is what you’d see running the same script on Linux/macOS for review — the formatting logic is identical either way, only the data source changes):
PS C:\scripts> ruby wmi_inventory.rb --json report.json --top-cpu 3
============================================================
SYSTEM INVENTORY REPORT
============================================================
OS: Microsoft Windows Server 2022 Standard (64-bit), version 10.0.20348
Memory: 16384 MB total, 50.0% used
------------------------------------------------------------
Disks:
  C: NTFS 250.0 GB total, 85.0% used  <-- WARNING: low free space
  D: NTFS 500.0 GB total, 20.0% used
------------------------------------------------------------
Top memory-consuming processes:
  sqlservr.exe         pid=5100     1953.1 MB
  w3wp.exe             pid=4021     488.3 MB
  svchost.exe          pid=988      61.0 MB
============================================================

JSON report written to report.json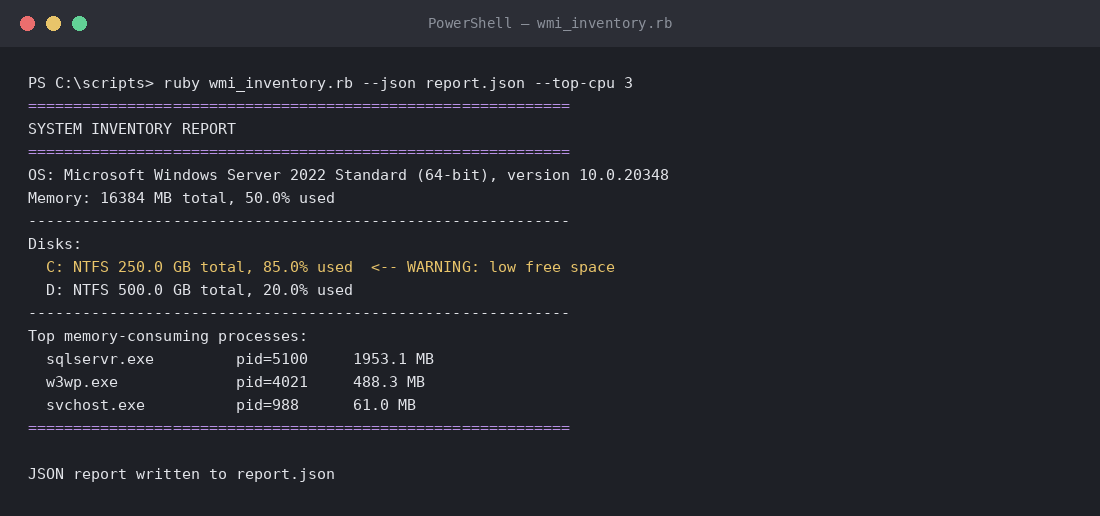
Scheduling It
Wire this into Windows Task Scheduler for a recurring inventory snapshot:
schtasks /create /tn "WMI Inventory Report" /tr "ruby C:\scripts\wmi_inventory.rb --json C:\reports\inventory.json" /sc daily /st 06:00 /ru SYSTEMOr from PowerShell directly, if you’d rather trigger it from an existing automation script: Start-Process ruby -ArgumentList "wmi_inventory.rb --json C:\reports\inventory.json".
Troubleshooting
NoMethodError/win32olefails to load — you’re running a non-Windows Ruby build, or a Windows Ruby build that wasn’t compiled with COM support (rare, but possible with some minimal builds). Use the standard RubyInstaller distribution.WIN32OLERuntimeError: unknown property or method— a property name doesn’t exist on that WMI class in your Windows version, or was mistyped. Cross-check against Microsoft’s WMI reference for the specific class (e.g.,Win32_LogicalDisk) to confirm the exact property spelling.- Access denied querying
Win32_Process— re-run from an elevated (Administrator) prompt; process enumeration for other users’ sessions is restricted by default. - Script hangs on a remote host — if you change the namespace to point at a remote machine (
winmgmts://HOSTNAME/root/cimv2), firewall rules for DCOM/WMI (TCP 135 plus a dynamic RPC port range) must be open between the two machines — a very common blocker in locked-down networks. - Numbers look wrong — double check the unit conversion; a handful of WMI properties (like
Win32_PhysicalMemory.Capacity, not used here) report in bytes while others (Win32_OperatingSystem.TotalVisibleMemorySize, used here) report in kilobytes. Always check the property’s documented unit before assuming.
Extending the Script
- Service inventory: add a
Win32_Servicequery to list stopped services configured to auto-start — a common source of “why didn’t this come back up after the reboot” incidents. - Event Log summary: pair this with a query against
Win32_NTLogEvent(or the newerGet-WinEvent-style approach) to fold recent error/warning counts into the same report. - Remote fleet scans: parameterize the namespace with a hostname and loop over a list of servers, aggregating results into one fleet-wide inventory JSON file.
- Prometheus textfile export: instead of (or alongside) the JSON report, emit metrics in Prometheus’s textfile-collector format so this becomes a first-class input to existing Grafana dashboards.