Part of our Ruby for DevOps series — practical Ruby scripts that solve real system-administration problems.
The Problem
It’s 2am, your site is slow, and the only clue you have is a 4 GB nginx access log. grep and awk one-liners will get you part of the way, but the moment you need to answer several questions at once — which status codes spiked? which IPs are hammering us? which endpoints are throwing 500s? when did it start? — you end up re-scanning the same giant file five times and juggling half-remembered awk syntax.
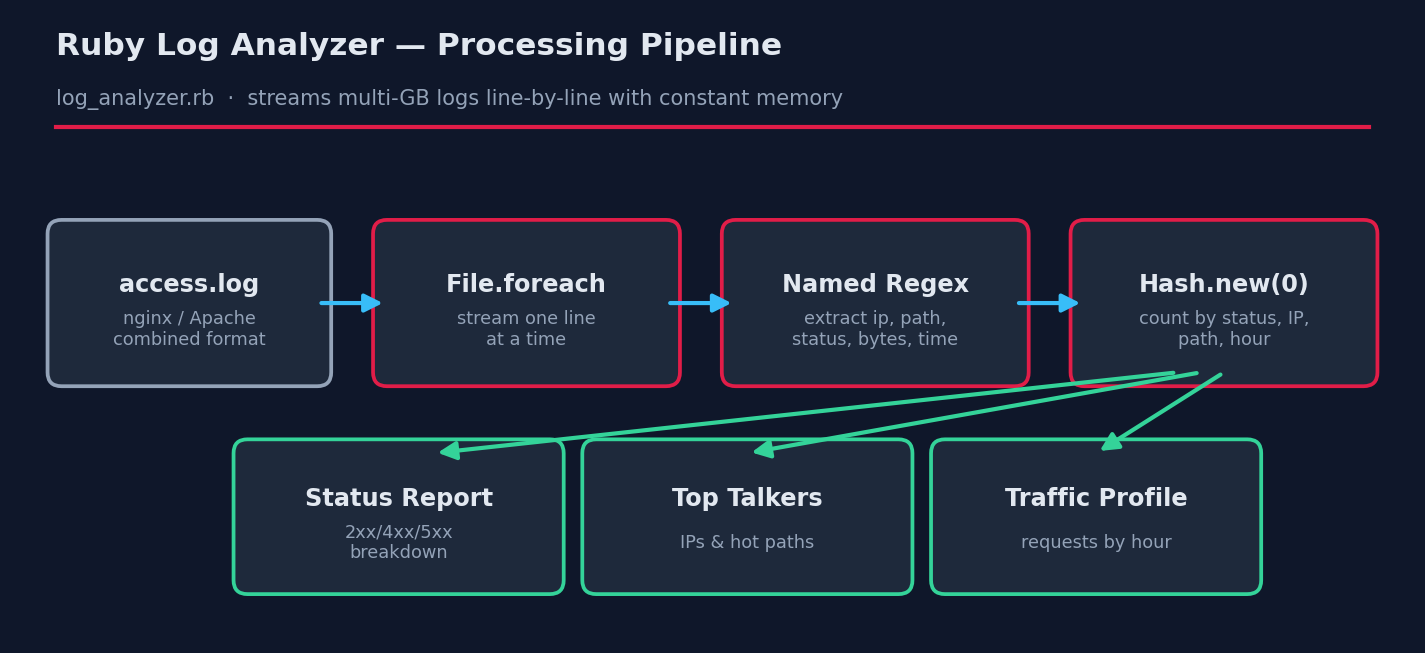
Ruby is a perfect middle ground: more expressive than shell, far less ceremony than Java or Go, and it’s either preinstalled or one package away on every Linux distribution. In this tutorial we’ll build a single-pass log analyzer that streams a log of any size using constant memory and produces a complete traffic report.
Prerequisites
- Ruby 2.7 or newer (3.x recommended). Check with
ruby --version. Install on Debian/Ubuntu withsudo apt install ruby-full, RHEL/Fedora withsudo dnf install ruby. - No gems required — this script uses only the Ruby standard library, so it runs on locked-down production boxes where
gem installisn’t an option. - An nginx or Apache access log in the standard combined format (the default on both servers).
The Complete Script
Save this as log_analyzer.rb:
#!/usr/bin/env ruby
# log_analyzer.rb -- Analyze web server access logs (nginx/Apache combined format)
#
# Usage: ruby log_analyzer.rb /path/to/access.log [--top N]
#
# Requires: Ruby 2.7+ (standard library only -- no gems needed)

require 'optparse'
require 'time'

# ---------------------------------------------------------------
# 1. Parse command-line options
# ---------------------------------------------------------------
options = { top: 10 }
OptionParser.new do |opts|
  opts.banner = "Usage: ruby log_analyzer.rb LOGFILE [--top N]"
  opts.on("--top N", Integer, "Show top N entries (default 10)") { |n| options[:top] = n }
end.parse!

logfile = ARGV[0] or abort "ERROR: please provide a log file path"
abort "ERROR: file not found: #{logfile}" unless File.exist?(logfile)

# ---------------------------------------------------------------
# 2. Regex for the 'combined' log format used by nginx and Apache
#    IP - user [time] "METHOD /path HTTP/x" status bytes "referer" "agent"
# ---------------------------------------------------------------
LOG_PATTERN = /
  ^(?<ip>\S+)\s+\S+\s+\S+\s+
  \[(?<time>[^\]]+)\]\s+
  "(?<method>[A-Z]+)\s+(?<path>\S+)[^"]*"\s+
  (?<status>\d{3})\s+
  (?<bytes>\d+|-)
/x

# ---------------------------------------------------------------
# 3. Stream the file line by line (memory-safe for multi-GB logs)
# ---------------------------------------------------------------
stats = {
  total: 0, parsed: 0,
  by_status: Hash.new(0),
  by_ip: Hash.new(0),
  by_path: Hash.new(0),
  errors_by_path: Hash.new(0),
  bytes_total: 0,
  by_hour: Hash.new(0)
}

File.foreach(logfile) do |line|
  stats[:total] += 1
  m = LOG_PATTERN.match(line) or next
  stats[:parsed] += 1

  status = m[:status].to_i
  stats[:by_status][status] += 1
  stats[:by_ip][m[:ip]] += 1
  stats[:by_path][m[:path]] += 1
  stats[:errors_by_path][m[:path]] += 1 if status >= 400
  stats[:bytes_total] += m[:bytes].to_i unless m[:bytes] == '-'

  # Bucket requests by hour for a simple traffic profile
  begin
    t = Time.strptime(m[:time], '%d/%b/%Y:%H:%M:%S %z')
    stats[:by_hour][t.hour] += 1
  rescue ArgumentError
    # Ignore unparseable timestamps
  end
end

# ---------------------------------------------------------------
# 4. Report
# ---------------------------------------------------------------
def section(title) = puts("\n=== #{title} " + "=" * (50 - title.length))

puts "Analyzed: #{logfile}"
puts "Lines: #{stats[:total]} total, #{stats[:parsed]} parsed " \
     "(#{stats[:total] - stats[:parsed]} skipped)"
puts "Data transferred: #{(stats[:bytes_total] / 1024.0 / 1024.0).round(2)} MB"

section "Status code breakdown"
stats[:by_status].sort.each do |code, count|
  pct = (100.0 * count / stats[:parsed]).round(1)
  bar = "#" * (pct / 2).ceil
  puts format("  %3d  %6d  %5.1f%%  %s", code, count, pct, bar)
end

section "Top #{options[:top]} client IPs"
stats[:by_ip].max_by(options[:top]) { |_, c| c }.each do |ip, count|
  puts format("  %-18s %6d requests", ip, count)
end

section "Top #{options[:top]} requested paths"
stats[:by_path].max_by(options[:top]) { |_, c| c }.each do |path, count|
  puts format("  %-40s %6d", path[0, 40], count)
end

section "Paths generating errors (4xx/5xx)"
if stats[:errors_by_path].empty?
  puts "  none -- clean log!"
else
  stats[:errors_by_path].max_by(options[:top]) { |_, c| c }.each do |path, count|
    puts format("  %-40s %6d errors", path[0, 40], count)
  end
end

section "Requests by hour (UTC)"
(0..23).each do |h|
  count = stats[:by_hour][h]
  puts format("  %02d:00  %6d  %s", h, count, "#" * [count / 5, 60].min) if count > 0
end
How It Works, Step by Step
1. A named-capture regex for the combined log format
The heart of the script is the LOG_PATTERN regex, written in extended mode (/x) so it can be spread across lines with comments. Named captures (?<ip>, ?<status>, …) mean we later write m[:status] instead of the cryptic m[3] — six months from now you’ll still understand it.
2. Streaming with File.foreach
The single most important line for real-world use is File.foreach(logfile). Unlike File.read (loads the whole file into RAM) or File.readlines (builds a giant array), foreach yields one line at a time. Memory use stays flat whether the log is 10 MB or 40 GB.
3. Counting with Hash.new(0)
Hash.new(0) creates a hash whose missing keys default to zero, so stats[:by_ip][ip] += 1 just works with no if guard. This idiom replaces a dozen lines of bookkeeping.
4. Defensive parsing
Real logs contain garbage: truncated lines from log rotation, weird bot requests, embedded quotes. The match or next pattern silently skips anything that doesn’t parse, and we report the skipped count at the end so corruption never hides from you. Timestamp parsing is wrapped in a rescue ArgumentError for the same reason.
5. The report
Each section sorts a counter hash and pretty-prints it with format. The status breakdown includes a simple ASCII bar chart — surprisingly useful for spotting a 404 or 500 spike at a glance over SSH.
Example Output
$ ruby log_analyzer.rb sample_access.log --top 5

Analyzed: sample_access.log
Lines: 3001 total, 3000 parsed (1 skipped)
Data transferred: 71.06 MB

=== Status code breakdown =============================
  200    1465   48.8%  #########################
  301     324   10.8%  ######
  403     282    9.4%  #####
  404     617   20.6%  ###########
  500     312   10.4%  ######

=== Top 5 client IPs ==================================
  66.249.66.1           464 requests
  203.0.113.5           445 requests
  203.0.113.9           440 requests
  192.0.2.44            430 requests
  157.55.39.2           412 requests

=== Top 5 requested paths =============================
  /api/v1/users                               324
  /login                                      313
  /images/logo.png                            304
  /favicon.ico                                303
  /blog/post-1                                299

=== Paths generating errors (4xx/5xx) =================
  /login                                      132 errors
  /blog/post-1                                129 errors
  /api/v1/orders                              123 errors
  /api/v1/health                              123 errors
  /checkout                                   122 errors

=== Requests by hour (UTC) ============================
  02:00     356  ############################################################
  03:00     372  ############################################################
  09:00     372  ############################################################
  10:00     370  ############################################################
  11:00     375  ############################################################
  14:00     406  ############################################################
  15:00     367  ############################################################
  20:00     382  ############################################################
In this (synthetic) log you can immediately spot the story: a 20% 404 rate, errors concentrated on /login and the API endpoints, and bot traffic (66.249.66.1 is Googlebot’s range) leading the top talkers.
Troubleshooting
- “0 parsed” but the file has data — your server likely uses a custom
log_format. Compare one log line against the regex; most custom formats only need a small tweak (e.g., an extra$request_timefield at the end is already tolerated because the regex is not anchored at the end). - invalid byte sequence in UTF-8 — logs sometimes contain binary junk from attack traffic. Change the loop line to
File.foreach(logfile, encoding: 'BINARY')or addline.scrub!as the first statement in the block. - It’s slow on huge files — Ruby will do roughly 200–500k lines/second here. For a 100M-line log, pre-filter with
grepfirst (e.g., only 5xx lines) and pipe: changeFile.foreach(logfile)toARGF.each_lineand rungrep ' 50[0-9] ' access.log | ruby log_analyzer.rb -. - Compressed rotated logs — read them without unpacking:
Zlib::GzipReader.open('access.log.1.gz') { |gz| gz.each_line { ... } }.
Extending the Script
- GeoIP enrichment — add the
maxmind-geoip2gem and map top IPs to countries. - Alerting — exit non-zero when the 5xx rate exceeds a threshold and wire it into cron; you’ll get mail on failure for free.
- CSV/JSON export — swap the report section for
require 'json'; puts stats.to_jsonand feed dashboards. - Tail mode — combine with
File#seekto remember the last read offset and process only new lines each run — a poor man’s log shipper.