Part of our Ruby for DevOps series — practical Ruby scripts that solve real system-administration problems.
The Problem
The classic monitoring gap: full-blown observability stacks (Prometheus, Datadog, Nagios) are great, but there’s always a box that isn’t covered — the legacy VM, the build server, the client machine you can’t install agents on. Meanwhile the questions you actually need answered are simple: is nginx still running? is anything eating all the memory? are zombies piling up?
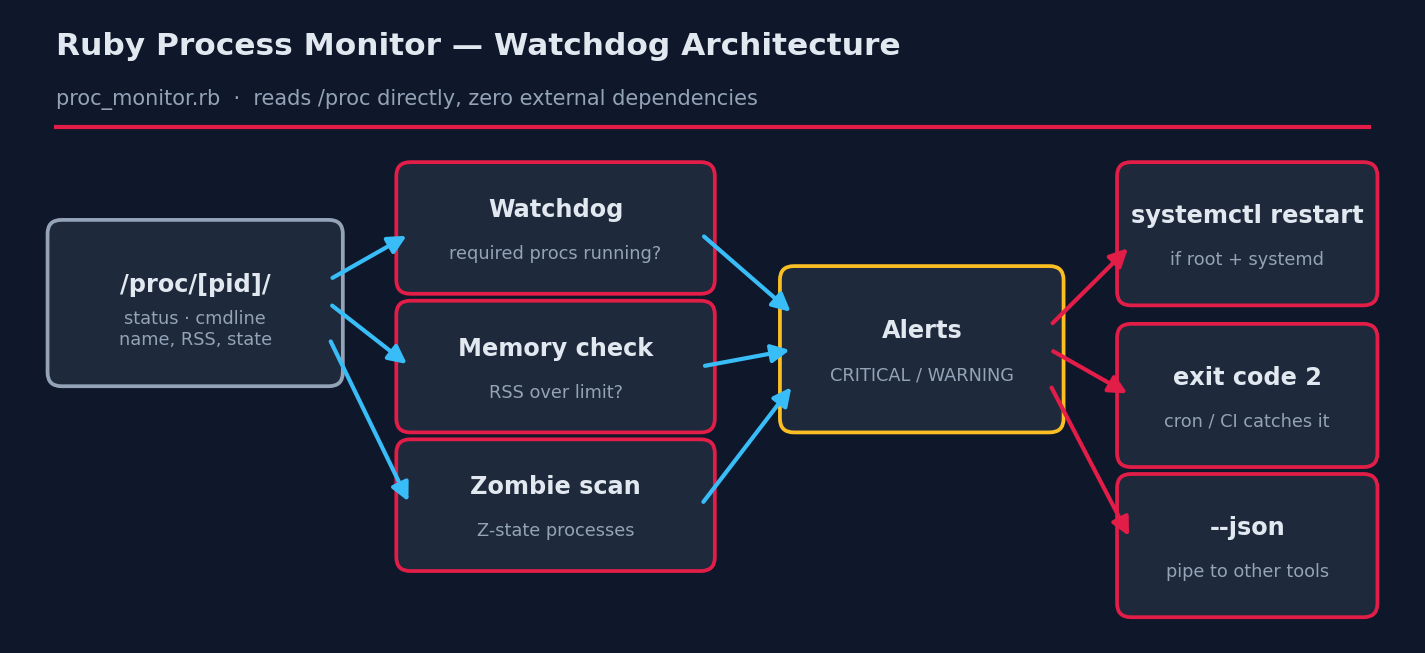
This tutorial builds a dependency-free watchdog in Ruby that reads the Linux /proc filesystem directly — no gems, no agents, nothing to install beyond Ruby itself. It checks required processes, flags memory hogs and zombies, can restart dead systemd services, and speaks JSON so other tools can consume it.
Prerequisites
- Ruby 2.7+, standard library only.
- Linux — the script reads
/proc, which is Linux-specific. (Windows equivalent: query WMI viawin32ole— see Extending below.) - Root only if you want automatic
systemctl restart; all read-only checks work as any user.
The Complete Script
Save this as proc_monitor.rb:
#!/usr/bin/env ruby
# proc_monitor.rb -- Process & service watchdog for Linux
#
# Checks that critical processes are running, watches CPU/memory usage,
# and (optionally) restarts systemd services that have died.
#
# Usage:
#   ruby proc_monitor.rb                       # one-shot report
#   ruby proc_monitor.rb --watch nginx,sshd    # check specific processes
#   ruby proc_monitor.rb --mem-limit 500       # flag procs over 500 MB RSS
#
# Requires: Ruby 2.7+ (standard library only). Reads /proc directly,
# so no external gems or commands are needed for process data.

require 'optparse'
require 'json'

options = { watch: [], mem_limit: nil, top: 5, json: false }
OptionParser.new do |opts|
  opts.banner = "Usage: ruby proc_monitor.rb [options]"
  opts.on("--watch LIST", "Comma-separated process names that MUST be running") { |v| options[:watch] = v.split(",").map(&:strip) }
  opts.on("--mem-limit MB", Integer, "Flag processes using more than MB of RSS") { |v| options[:mem_limit] = v }
  opts.on("--top N", Integer, "Show top N by memory (default 5)") { |v| options[:top] = v }
  opts.on("--json", "Emit JSON (for piping into other tools)") { options[:json] = true }
end.parse!

# ---------------------------------------------------------------
# 1. Collect processes straight from /proc.
#    Each numeric directory under /proc is a PID. /proc/PID/status
#    gives us the name and memory; /proc/PID/cmdline the full command.
# ---------------------------------------------------------------
def collect_processes
  Dir.glob("/proc/[0-9]*").filter_map do |dir|
    pid = File.basename(dir).to_i
    status = File.read("#{dir}/status")
    name   = status[/^Name:\s+(.+)$/, 1]
    rss_kb = status[/^VmRSS:\s+(\d+)\s+kB/, 1].to_i
    state  = status[/^State:\s+(\S+)/, 1]
    cmd    = File.read("#{dir}/cmdline").tr("\0", " ").strip rescue ""
    { pid: pid, name: name, rss_mb: (rss_kb / 1024.0).round(1),
      state: state, cmd: cmd.empty? ? "[#{name}]" : cmd[0, 60] }
  rescue Errno::ENOENT, Errno::EACCES
    nil  # process exited mid-scan or is not readable -- skip it
  end
end

procs = collect_processes
alerts = []

# ---------------------------------------------------------------
# 2. Watchdog: are all required processes present?
# ---------------------------------------------------------------
# NOTE: we exclude our own PID -- otherwise this script's command line
# ("--watch nginx,...") would match the search and mask a dead service!
candidates = procs.reject { |p| p[:pid] == Process.pid }

options[:watch].each do |want|
  found = candidates.select { |p| p[:name] == want || p[:cmd].include?(want) }
  if found.empty?
    alerts << { level: "CRITICAL", msg: "required process '#{want}' is NOT running" }
  end
end

# ---------------------------------------------------------------
# 3. Memory limit check
# ---------------------------------------------------------------
if options[:mem_limit]
  procs.select { |p| p[:rss_mb] > options[:mem_limit] }.each do |p|
    alerts << { level: "WARNING",
                msg: "PID #{p[:pid]} (#{p[:name]}) using #{p[:rss_mb]} MB " \
                     "(limit #{options[:mem_limit]} MB)" }
  end
end

# ---------------------------------------------------------------
# 4. Zombie detection -- Z-state processes indicate a parent that
#    is not reaping its children.
# ---------------------------------------------------------------
procs.select { |p| p[:state] == "Z" }.each do |p|
  alerts << { level: "WARNING", msg: "zombie process PID #{p[:pid]} (#{p[:name]})" }
end

# ---------------------------------------------------------------
# 5. Optional systemd integration: try to restart dead watched
#    services if systemctl exists AND we're running as root.
# ---------------------------------------------------------------
def try_restart(service)
  return "systemctl not available" unless system("which systemctl > /dev/null 2>&1")
  return "not running as root -- skipping restart" unless Process.uid.zero?
  ok = system("systemctl", "restart", service)
  ok ? "restart issued" : "restart FAILED"
end

alerts.select { |a| a[:level] == "CRITICAL" }.each do |a|
  service = a[:msg][/'(.+)'/, 1]
  a[:action] = try_restart(service)
end

# ---------------------------------------------------------------
# 6. Report
# ---------------------------------------------------------------
if options[:json]
  puts JSON.pretty_generate(
    total: procs.size, alerts: alerts,
    top_memory: procs.max_by(options[:top]) { |p| p[:rss_mb] }
  )
else
  puts "Process report -- #{Time.now.strftime('%F %T')}"
  puts "Total processes: #{procs.size}"

  puts "\nTop #{options[:top]} by memory:"
  procs.max_by(options[:top]) { |p| p[:rss_mb] }.each do |p|
    puts format("  %6d  %-20s %8.1f MB  %s", p[:pid], p[:name], p[:rss_mb], p[:state])
  end

  if alerts.empty?
    puts "\nAlerts: none -- all clear."
  else
    puts "\nAlerts (#{alerts.size}):"
    alerts.each do |a|
      line = "  [#{a[:level]}] #{a[:msg]}"
      line += " -> #{a[:action]}" if a[:action]
      puts line
    end
  end
end

# Non-zero exit if anything critical -- lets cron/CI catch failures
exit(alerts.any? { |a| a[:level] == "CRITICAL" } ? 2 : 0)
How It Works, Step by Step
1. /proc is just files
Every process on Linux appears as a numbered directory under /proc. /proc/PID/status is a plain-text key/value file with the process name, state and memory; /proc/PID/cmdline holds the full command line with NUL separators (hence the tr("\0", " ")). Reading these files is exactly what ps does under the hood — we’re just cutting out the middleman, which also makes the script faster than shelling out to ps thousands of times.
2. Processes vanish mid-scan — plan for it
Between listing /proc and reading a PID’s files, that process may exit. The rescue Errno::ENOENT inside filter_map treats that as normal (it is), skipping the entry instead of crashing. This race is the #1 bug in naive process scanners.
3. The self-match trap
Here’s a subtle bug we hit while writing this script — and that also bites people using pgrep -f: when you run ruby proc_monitor.rb --watch nginx, the monitor’s own command line contains the string “nginx”. Without excluding our own PID, the watchdog finds itself, decides nginx is running, and a dead web server sails through unnoticed. One line fixes it: procs.reject { |p| p[:pid] == Process.pid }.
ps aux | grep nginx matches the grep itself. That’s why the old grep [n]ginx trick exists.4. Zombie detection
A process in state Z is dead but unreaped — its parent hasn’t called wait(). One or two are harmless; a growing pile means a buggy parent leaking children and eventually exhausting the PID table. The scan makes them visible before that happens.
5. Exit codes are an API
The script exits 2 on any CRITICAL alert. That single convention makes it composable: cron emails you on non-zero exit, systemd timers record the failure, CI gates on it, and a wrapper script can chain || send_page.
Example Output
$ ruby proc_monitor.rb --watch bash,nginx

Process report -- 2026-07-02 11:15:01
Total processes: 6

Top 5 by memory:
       7  ruby                     21.9 MB  R
       4  socat                     4.5 MB  S
       3  socat                     4.5 MB  S
       2  bash                      3.4 MB  S
       5  bash                      3.4 MB  S

Alerts (1):
  [CRITICAL] required process 'nginx' is NOT running -> not running as root -- skipping restart

$ echo $?
2
bash was found, nginx wasn’t — so we get a CRITICAL alert, an attempted remediation (skipped, since we weren’t root), and exit code 2 for the automation layer.
Scheduling It
# Every 5 minutes; cron mails the report only when something is wrong
*/5 * * * * /usr/bin/ruby /opt/scripts/proc_monitor.rb --watch nginx,postgres,redis-server --mem-limit 2048 || true
Troubleshooting
- Watched process “not running” but it is — process names in
/proc/PID/statusare truncated to 15 characters (redis-serverfits;some-long-daemon-namedoesn’t). Watch a substring of the command line instead, or compare againstcmd. - VmRSS missing / 0 MB for some PIDs — kernel threads have no userspace memory; they legitimately lack
VmRSS. The script already treats missing values as 0. - Restart says “restart FAILED” — the process name and the systemd unit name often differ (process
postgres, unitpostgresql.service). Map names to units explicitly if you use auto-restart seriously. - Permission denied on some /proc entries — normal for other users’ processes under hardened kernels (
hidepid). Run as root for full visibility.
Extending the Script
- Windows version — swap the
/procreader for WMI:require 'win32ole'; wmi = WIN32OLE.connect("winmgmts://"); wmi.ExecQuery("SELECT Name, ProcessId, WorkingSetSize FROM Win32_Process"). The alert/restart logic stays identical (usesc startinstead of systemctl). - CPU usage — read
/proc/PID/statutime/stime twice with a 1s sleep and diff, divided by clock ticks. - Webhooks — POST the
--jsonoutput to Slack/Discord/PagerDuty withNet::HTTPwhen alerts are present. - State tracking — write alerts to a state file and only notify on changes, so a flapping service doesn’t page you every 5 minutes.