
Part of our Ruby for DevOps series — practical Ruby scripts that solve real system-administration problems.
The Problem
A box starts feeling slow, a scheduled backup takes three times as long as usual, or a support ticket says “the API is timing out again.” Nine times out of ten, the first question is: is something saturating the network link? On Linux, the kernel already tracks exactly this — every network interface’s cumulative bytes received and transmitted live in /proc/net/dev — but nothing is watching it or telling you when it crosses a line you care about.
You could install vnstat or wire up a full Prometheus/Grafana stack, and for long-term trending you probably should. But when you just need a fast, dependency-free way to watch an interface during a deploy, a load test, or a “why is this server slow right now” investigation, a small Ruby script that polls /proc/net/dev, computes throughput, and yells when it crosses a threshold is often exactly the right amount of tooling.
Prerequisites
- Ruby 2.7+ (tested on Ruby 3.0.2)
- Linux (relies on
/proc/net/dev, which is Linux-specific — this will not work on macOS or Windows) - No gems required — only Ruby’s standard library (
optparse) - No special privileges — reading
/proc/net/devdoes not require root
The Code
Here is the complete script. It’s a single file with no external dependencies.
#!/usr/bin/env ruby
# frozen_string_literal: true
#
# bandwidth_monitor.rb
#
# Polls /proc/net/dev at a fixed interval, computes per-interface RX/TX
# throughput (bytes/sec), and prints an alert whenever an interface crosses
# a configurable threshold. No gems required -- pure Ruby + the Linux /proc
# filesystem.
#
# Usage:
#   ruby bandwidth_monitor.rb [--interval SECONDS] [--threshold MBPS] [--iterations N]
#
# Examples:
#   ruby bandwidth_monitor.rb                       # defaults: 2s interval, 50 Mbps threshold, runs forever
#   ruby bandwidth_monitor.rb --interval 5 --threshold 100
#   ruby bandwidth_monitor.rb --iterations 3         # run 3 samples then exit (handy for testing/cron)

require 'optparse'

# ---------------------------------------------------------------------------
# Options
# ---------------------------------------------------------------------------
options = {
  interval: 2,      # seconds between samples
  threshold: 50.0,  # Mbps -- alert when RX+TX throughput exceeds this
  iterations: 0,    # 0 = run forever
  proc_path: '/proc/net/dev'
}

OptionParser.new do |opts|
  opts.banner = 'Usage: bandwidth_monitor.rb [options]'

  opts.on('-i', '--interval SECONDS', Float, 'Seconds between samples (default 2)') do |v|
    options[:interval] = v
  end

  opts.on('-t', '--threshold MBPS', Float, 'Alert threshold in megabits/sec (default 50)') do |v|
    options[:threshold] = v
  end

  opts.on('-n', '--iterations N', Integer, 'Number of samples to take, 0 = infinite (default 0)') do |v|
    options[:iterations] = v
  end

  opts.on('-h', '--help', 'Show this help') do
    puts opts
    exit
  end
end.parse!

# ---------------------------------------------------------------------------
# Core: read and parse /proc/net/dev
# ---------------------------------------------------------------------------
# Sample line format (leading whitespace on the interface name is normal):
#     eth0: 1234567   890    0    0    0     0          0         0  654321    456    0    0    0     0       0          0
#
# Columns after the colon are, in order:
#   RX: bytes packets errs drop fifo frame compressed multicast
#   TX: bytes packets errs drop fifo colls carrier    compressed
#
# We only need RX bytes (index 0) and TX bytes (index 8).
def read_interface_stats(proc_path)
  stats = {}
  File.readlines(proc_path).drop(2).each do |line|
    name, rest = line.split(':', 2)
    next unless name && rest

    name = name.strip
    next if name == 'lo' # loopback is noise for bandwidth alerting

    fields = rest.split
    rx_bytes = fields[0].to_i
    tx_bytes = fields[8].to_i
    stats[name] = { rx_bytes: rx_bytes, tx_bytes: tx_bytes }
  end
  stats
end

# ---------------------------------------------------------------------------
# Compute Mbps between two samples taken `elapsed` seconds apart
# ---------------------------------------------------------------------------
def compute_rates(prev, curr, elapsed)
  rates = {}
  curr.each do |iface, now|
    before = prev[iface]
    next unless before # interface appeared between samples; skip this round

    rx_delta = now[:rx_bytes] - before[:rx_bytes]
    tx_delta = now[:tx_bytes] - before[:tx_bytes]

    # Counters can wrap/reset (interface flap, counter overflow); guard against negatives.
    rx_delta = 0 if rx_delta.negative?
    tx_delta = 0 if tx_delta.negative?

    rx_mbps = (rx_delta * 8.0) / elapsed / 1_000_000
    tx_mbps = (tx_delta * 8.0) / elapsed / 1_000_000

    rates[iface] = { rx_mbps: rx_mbps, tx_mbps: tx_mbps }
  end
  rates
end

def format_row(iface, rx, tx, threshold)
  total = rx + tx
  flag = total >= threshold ? '  <-- ALERT' : ''
  format('%-10s RX: %8.2f Mbps   TX: %8.2f Mbps   Total: %8.2f Mbps%s',
         iface, rx, tx, total, flag)
end

# ---------------------------------------------------------------------------
# Main loop
# ---------------------------------------------------------------------------
def run(options)
  puts "Monitoring #{options[:proc_path]} every #{options[:interval]}s " \
       "(alert threshold: #{options[:threshold]} Mbps combined RX+TX)"
  puts '-' * 72

  prev = read_interface_stats(options[:proc_path])
  count = 0

  loop do
    sleep options[:interval]
    curr = read_interface_stats(options[:proc_path])
    rates = compute_rates(prev, curr, options[:interval])

    timestamp = Time.now.strftime('%Y-%m-%d %H:%M:%S')
    if rates.empty?
      puts "[#{timestamp}] no interfaces to report (only loopback present?)"
    else
      puts "[#{timestamp}]"
      rates.each do |iface, r|
        row = format_row(iface, r[:rx_mbps], r[:tx_mbps], options[:threshold])
        puts row
        if (r[:rx_mbps] + r[:tx_mbps]) >= options[:threshold]
          warn "ALERT: #{iface} exceeded #{options[:threshold]} Mbps " \
               "(RX #{r[:rx_mbps].round(2)} / TX #{r[:tx_mbps].round(2)})"
        end
      end
    end

    prev = curr
    count += 1
    break if options[:iterations].positive? && count >= options[:iterations]
  end
end

run(options) if __FILE__ == $PROGRAM_NAME
Step-by-Step Walkthrough
1. Reading the kernel’s counters
read_interface_stats opens /proc/net/dev and skips its two header lines. Each remaining line looks like this:
eth0: 1234567 890 0 0 0 0 0 0 654321 456 0 0 0 0 0 0Everything before the colon is the interface name; everything after is 16 whitespace-separated fields. The first 8 are receive (RX) stats, the last 8 are transmit (TX) stats, and in both groups the first field is a running total of bytes since the interface came up. We only need fields[0] (RX bytes) and fields[8] (TX bytes) — index math based directly on the kernel’s fixed column order. The loopback interface (lo) is skipped since it’s local-only traffic and just adds noise.
2. Turning two snapshots into a rate
Byte counters are cumulative, not instantaneous, so a single read only tells you “how much data has this interface ever moved” — not “how fast is it moving right now.” compute_rates takes two samples taken elapsed seconds apart, subtracts them, and converts the delta into megabits per second: (delta_bytes * 8.0) / elapsed / 1_000_000. The * 8.0 converts bytes to bits, since network speeds are conventionally quoted in bits/sec (a “100 Mbps link”), not bytes/sec. There’s also a guard against negative deltas — if an interface is replaced or a counter wraps between samples, we clamp to zero rather than reporting a nonsensical negative throughput.
3. The polling loop
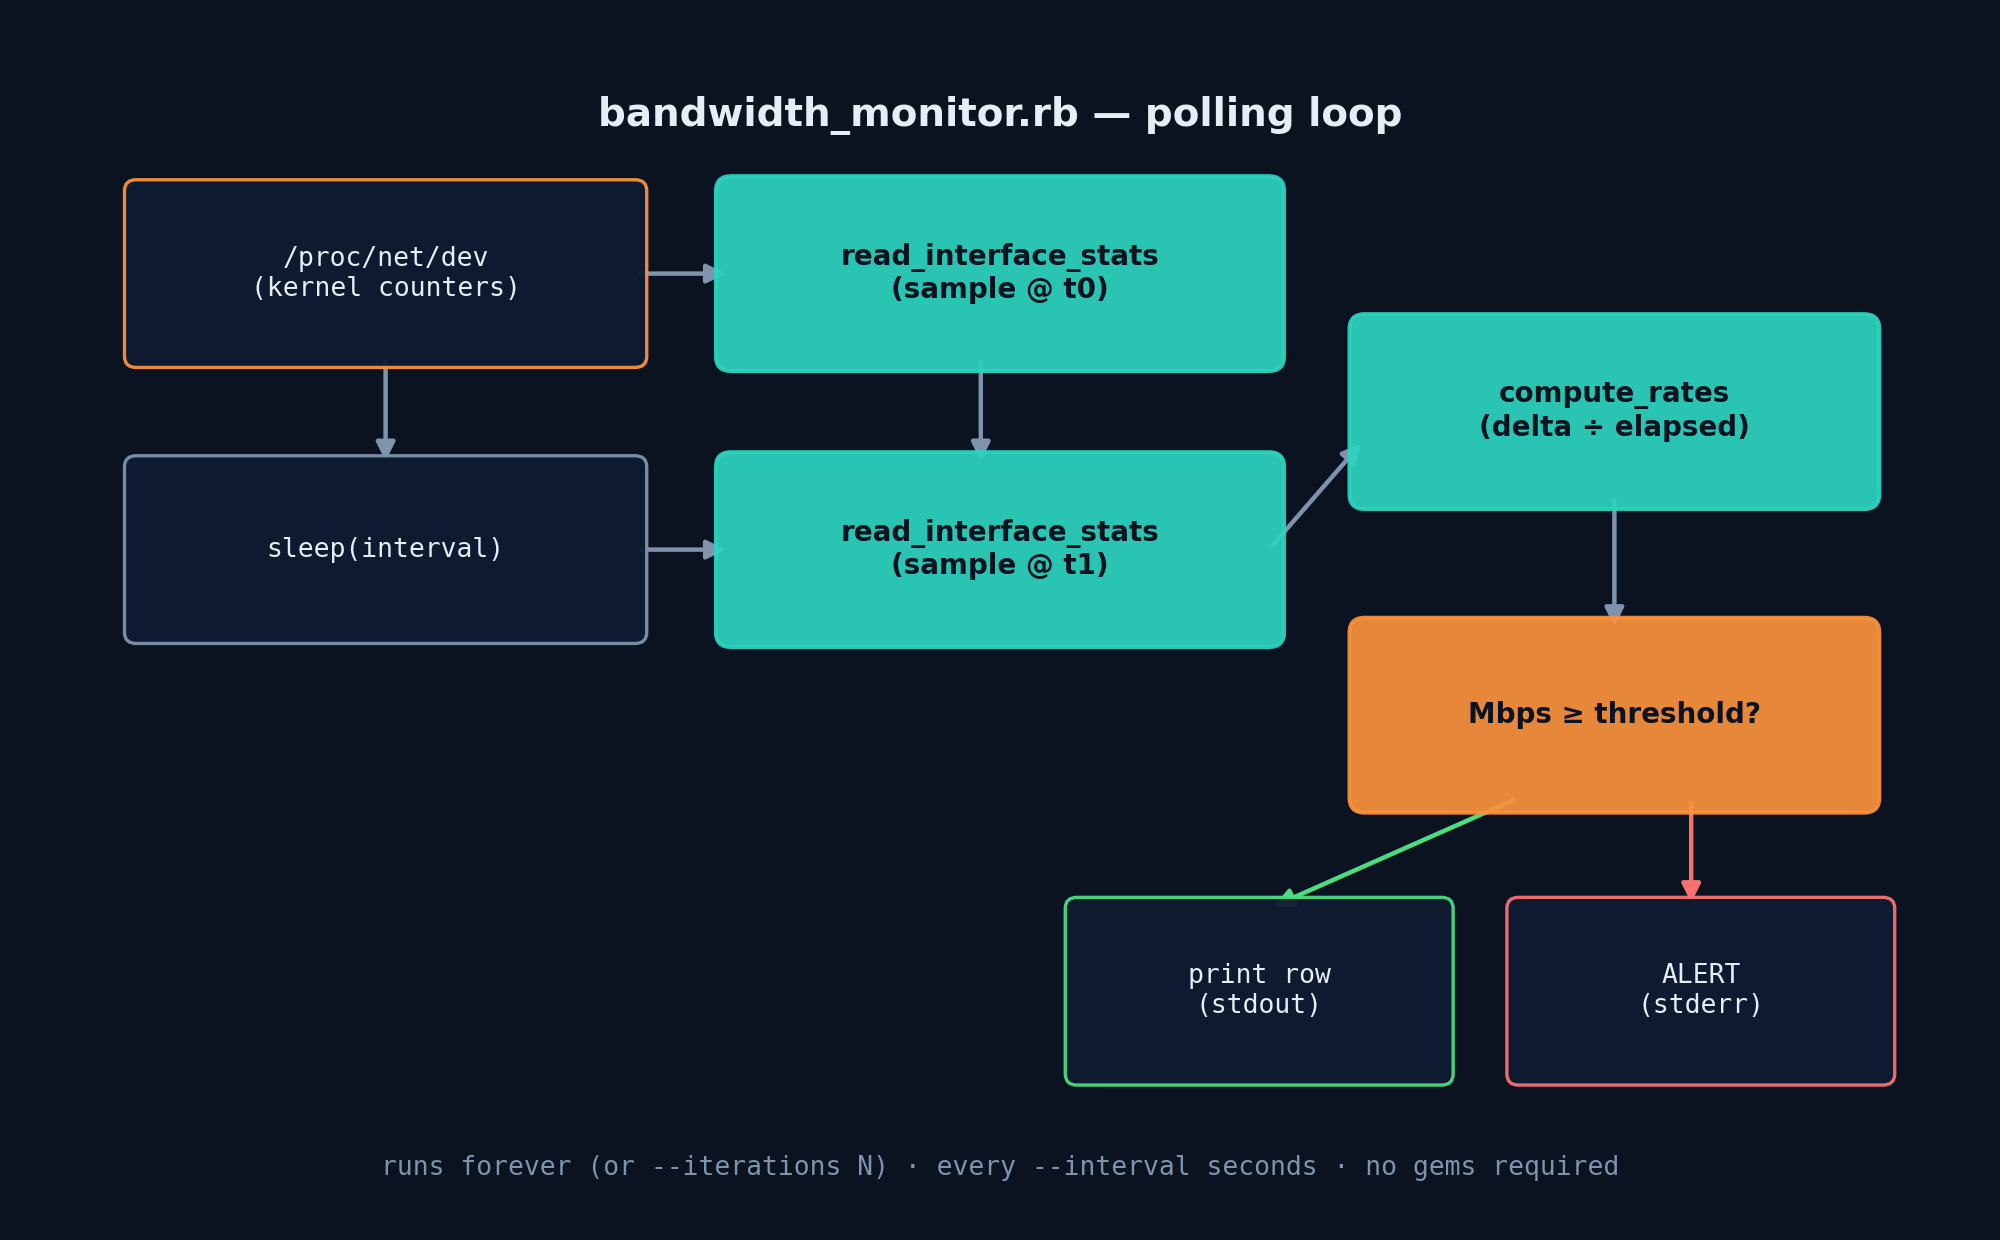
run takes an initial sample, then loops forever (or for --iterations rounds, handy for testing or a cron-triggered single check): sleep, sample again, compute rates, print a row per interface, and write an ALERT line to stderr for any interface whose combined RX+TX throughput meets or exceeds --threshold. Writing alerts to stderr instead of stdout means you can pipe stdout to a log file while still seeing alerts in your terminal, or have a process supervisor treat stderr output as the signal to page someone.
Example Output
$ ruby bandwidth_monitor.rb --interval 2 --threshold 50
Monitoring /proc/net/dev every 2.0s (alert threshold: 50.0 Mbps combined RX+TX)
------------------------------------------------------------------------
[2026-07-20 09:14:02]
eth0       RX:    12.40 Mbps   TX:     3.10 Mbps   Total:    15.50 Mbps
[2026-07-20 09:14:04]
eth0       RX:   102.88 Mbps   TX:    41.20 Mbps   Total:   144.08 Mbps  <-- ALERT
ALERT: eth0 exceeded 50.0 Mbps (RX 102.88 / TX 41.2)
[2026-07-20 09:14:06]
eth0       RX:     8.02 Mbps   TX:     2.55 Mbps   Total:    10.57 Mbps
Verifying the Logic
Since throughput requires two points in time, the cleanest way to unit-test this without waiting around is to feed read_interface_stats two captured snapshots of /proc/net/dev — one representing “now” and one representing “2 seconds from now” — and check the math:
$ ruby -e '
require "./bandwidth_monitor.rb"
prev = read_interface_stats("/tmp/fake_net_dev_1")
curr = read_interface_stats("/tmp/fake_net_dev_2")
rates = compute_rates(prev, curr, 2.0)
puts format_row("eth0", rates["eth0"][:rx_mbps], rates["eth0"][:tx_mbps], 50.0)
'
eth0       RX:   100.00 Mbps   TX:    50.00 Mbps   Total:   150.00 Mbps  <-- ALERT
25,000,000 bytes of RX delta over 2 seconds is exactly 100 Mbps (25,000,000 × 8 ÷ 2 ÷ 1,000,000), confirming the rate calculation is correct before you ever point it at a real interface.
Troubleshooting
- “no interfaces to report (only loopback present?)” — you’re likely running this inside a minimal container or sandbox with no real network interface attached; test with the fixture-file technique above instead.
- Rates look impossibly high or negative — usually caused by an interface flapping (going down and back up) between samples, which resets its counters to zero. The script clamps negative deltas to zero, but a very large positive spike right after a flap is expected; increase
--intervalif this is a problem in practice. - Script exits immediately with an OptionParser error — double check flag syntax;
--thresholdand--intervalexpect numbers, not strings. - Nothing happens for a long time — that’s expected; the script blocks on
sleep(interval)between samples. Use--iterations 1if you just want one immediate reading (after one interval).
Extending This Script
- Per-interface thresholds: replace the single
--thresholdwith a hash keyed by interface name, so a 1Gbps NIC and a 100Mbps management interface can have different limits. - Send alerts somewhere real: swap the
warncall for a Slack webhook POST (viaNet::HTTP, still no gems) or an email viaNet::SMTP. - Log to CSV or JSON Lines instead of (or alongside) stdout for later graphing with your tool of choice.
- Track packet rate and error/drop counters too — they’re sitting right there in the same
/proc/net/devline (fields 2-3 and 10-11) and are often better early-warning signals than raw throughput. - Run as a systemd service with
Restart=alwaysfor continuous monitoring rather than launching it ad hoc.