The Problem
Full observability platforms are great once you have a dozen services and a budget line for them. Before that, most teams end up with a gap: three or four internal APIs — an auth service, an internal admin panel, a webhook receiver — that nobody is actually watching. They fail quietly on a Friday night and you find out Monday morning from an angry Slack message, not a page.
You don’t need Prometheus and Grafana to close that gap. You need something that hits a list of URLs on a schedule, checks the status code
(and ideally the response body, since a service can return 200 while serving a broken page), retries before declaring
something actually down, and shouts into a webhook when it is. This tutorial builds api_healthcheck.rb: a single-file,
dependency-free health checker built entirely on Net::HTTP, designed to run from cron every minute or as a step in a CI
pipeline.
Prerequisites
- Ruby 3.x (tested on 3.0.2; the standard library APIs used here have been stable since Ruby 2.x)
- Works identically on Linux and Windows —
Net::HTTPhas no OS-specific behavior here - No Ruby gems required.
net/http,uri,yaml,json, andoptparseare all standard library - Outbound network access from wherever the script runs to the endpoints you’re checking (and to your webhook URL, if you use one)
If you’re checking dozens of endpoints per run and latency matters, look at Net::HTTP.start with keep-alive and connection
reuse, or run checks in parallel threads the same way the SSH fleet automation tutorial in this series does. For a handful of endpoints on
a one-minute cron interval, the straightforward sequential version below is simpler to reason about and easier to debug at 2am.
The Complete Code
#!/usr/bin/env ruby
# frozen_string_literal: true
#
# api_healthcheck.rb -- Poll a list of REST endpoints, verify status code
# (and optionally response body content), retry with backoff, and report
# uptime/latency. No third-party gems required -- just Net::HTTP.
#
# Usage:
#   ruby api_healthcheck.rb -c endpoints.yml
#   ruby api_healthcheck.rb -c endpoints.yml --webhook https://hooks.example.com/xxx
#
require 'net/http'
require 'uri'
require 'yaml'
require 'json'
require 'optparse'

# ---------------------------------------------------------------------------
# One endpoint to check, loaded from YAML.
# ---------------------------------------------------------------------------
Endpoint = Struct.new(:name, :url, :method, :expected_status, :body_matches,
                       :timeout, :retries, keyword_init: true)

CheckResult = Struct.new(:endpoint, :ok, :status_code, :latency_ms, :attempts,
                          :error, keyword_init: true)

# ---------------------------------------------------------------------------
# Performs one HTTP check, retrying with exponential backoff on failure.
# ---------------------------------------------------------------------------
class HealthChecker
  def initialize(default_timeout: 5, default_retries: 2)
    @default_timeout = default_timeout
    @default_retries = default_retries
  end

  def check(endpoint)
    timeout = endpoint.timeout || @default_timeout
    max_retries = endpoint.retries || @default_retries
    attempt = 0
    last_error = nil

    while attempt <= max_retries
      attempt += 1
      start = Time.now
      begin
        uri = URI.parse(endpoint.url)
        http = Net::HTTP.new(uri.host, uri.port)
        http.use_ssl = (uri.scheme == 'https')
        http.open_timeout = timeout
        http.read_timeout = timeout

        request_class = (endpoint.method || 'GET').upcase == 'HEAD' ? Net::HTTP::Head : Net::HTTP::Get
        request = request_class.new(uri)

        response = http.request(request)
        latency_ms = ((Time.now - start) * 1000).round(1)

        expected = endpoint.expected_status || 200
        status_ok = response.code.to_i == expected
        body_ok = endpoint.body_matches.nil? || response.body.to_s.match?(Regexp.new(endpoint.body_matches))

        if status_ok && body_ok
          return CheckResult.new(endpoint: endpoint, ok: true, status_code: response.code.to_i,
                                  latency_ms: latency_ms, attempts: attempt, error: nil)
        else
          last_error = "expected status #{expected}#{endpoint.body_matches ? " and body=~/#{endpoint.body_matches}/" : ''}, got #{response.code}"
        end
      rescue StandardError => e
        latency_ms = ((Time.now - start) * 1000).round(1)
        last_error = "#{e.class}: #{e.message}"
      end

      # Exponential backoff before the next attempt (skip after the last one)
      sleep(0.5 * (2**(attempt - 1))) if attempt <= max_retries
    end

    CheckResult.new(endpoint: endpoint, ok: false, status_code: nil,
                     latency_ms: nil, attempts: attempt, error: last_error)
  end
end

def load_endpoints(path)
  data = YAML.safe_load(File.read(path))
  (data['endpoints'] || []).map do |e|
    Endpoint.new(
      name: e['name'] || e['url'],
      url: e['url'],
      method: e['method'],
      expected_status: e['expected_status'],
      body_matches: e['body_matches'],
      timeout: e['timeout'],
      retries: e['retries']
    )
  end
end

def print_report(results)
  name_width = results.map { |r| r.endpoint.name.length }.max || 10
  puts
  puts format("%-#{name_width}s  %-6s  %6s  %8s  %s", 'ENDPOINT', 'STATUS', 'CODE', 'LATENCY', 'NOTE')
  puts '-' * (name_width + 55)
  results.each do |r|
    status = r.ok ? 'UP' : 'DOWN'
    code = r.status_code || '-'
    latency = r.latency_ms ? "#{r.latency_ms}ms" : '-'
    note = r.ok ? "#{r.attempts} attempt(s)" : r.error
    puts format("%-#{name_width}s  %-6s  %6s  %8s  %s", r.endpoint.name, status, code, latency, note)
  end
  puts
  up = results.count(&:ok)
  puts "#{up}/#{results.size} endpoints healthy"
end

def send_webhook(url, results)
  failures = results.reject(&:ok)
  return if failures.empty?

  uri = URI.parse(url)
  http = Net::HTTP.new(uri.host, uri.port)
  http.use_ssl = (uri.scheme == 'https')
  request = Net::HTTP::Post.new(uri)
  request['Content-Type'] = 'application/json'
  request.body = JSON.generate(
    text: "API health check: #{failures.size} endpoint(s) down",
    failures: failures.map { |r| { name: r.endpoint.name, url: r.endpoint.url, error: r.error } }
  )
  http.request(request)
rescue StandardError => e
  warn "webhook delivery failed: #{e.message}"
end

if $PROGRAM_NAME == __FILE__
  options = { timeout: 5, retries: 2, json: false }
  parser = OptionParser.new do |opts|
    opts.banner = 'Usage: api_healthcheck.rb -c endpoints.yml [options]'
    opts.on('-c', '--config PATH', 'YAML endpoint list (required)') { |v| options[:config] = v }
    opts.on('--timeout N', Integer, 'Default per-request timeout in seconds (default 5)') { |v| options[:timeout] = v }
    opts.on('--retries N', Integer, 'Default retry count on failure (default 2)') { |v| options[:retries] = v }
    opts.on('--webhook URL', 'POST a JSON alert here if anything is down') { |v| options[:webhook] = v }
    opts.on('--json', 'Emit machine-readable JSON instead of a text report') { options[:json] = true }
    opts.on('-h', '--help', 'Show this help') { puts opts; exit }
  end
  parser.parse!

  if options[:config].nil?
    warn parser
    exit 1
  end

  endpoints = load_endpoints(options[:config])
  if endpoints.empty?
    warn "No endpoints found in #{options[:config]}"
    exit 1
  end

  checker = HealthChecker.new(default_timeout: options[:timeout], default_retries: options[:retries])
  results = endpoints.map { |e| checker.check(e) }

  send_webhook(options[:webhook], results) if options[:webhook]

  if options[:json]
    puts JSON.pretty_generate(results.map do |r|
      { name: r.endpoint.name, url: r.endpoint.url, ok: r.ok, status_code: r.status_code,
        latency_ms: r.latency_ms, attempts: r.attempts, error: r.error }
    end)
  else
    print_report(results)
  end

  exit(results.all?(&:ok) ? 0 : 2)
end
Step-by-Step Walkthrough
1. Endpoint config
YAML again, for the same reason as the SSH tutorial in this series: the list of things you’re monitoring changes far more often than the logic that monitors them.
# endpoints.yml
endpoints:
  - name: auth-service
    url: https://auth.internal.example.com/healthz
    expected_status: 200
    body_matches: '"status":"ok"'
  - name: webhook-receiver
    url: https://hooks.internal.example.com/ping
    timeout: 3
  - name: admin-panel
    url: https://admin.internal.example.com/
    retries: 1
2. One check, with retry and backoff built in
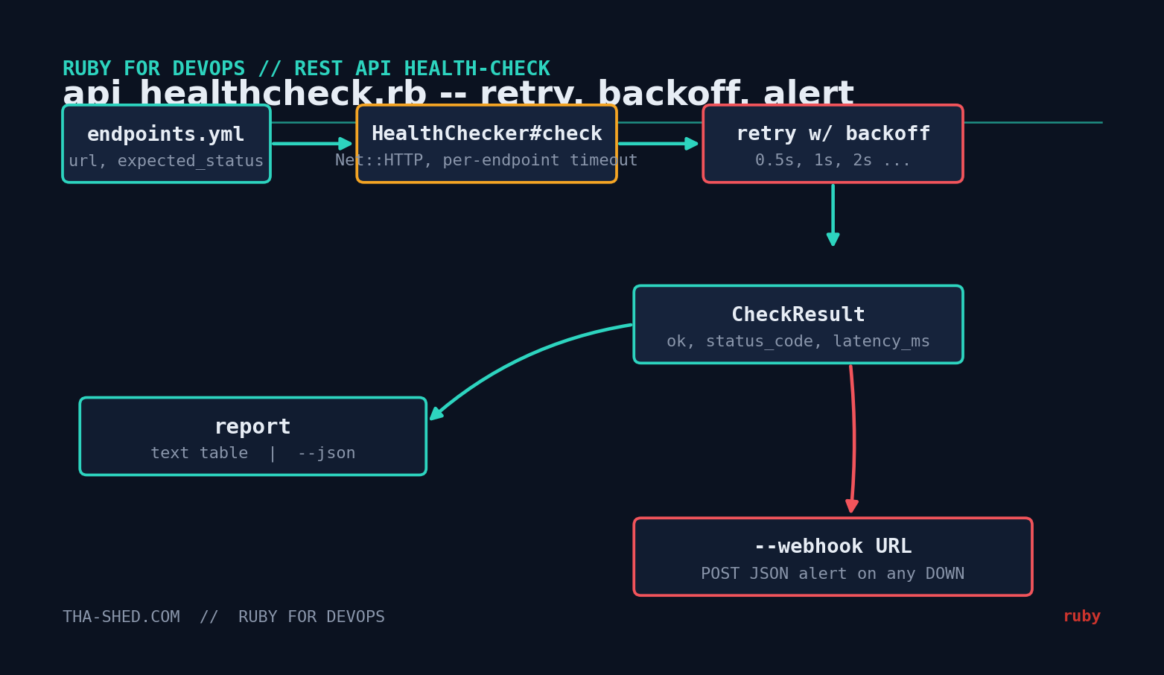
HealthChecker#check is a while loop, not a single request. A single failed request against a healthy service
happens all the time — a dropped packet, a brief GC pause on the other end — and treating that as “down” produces alert fatigue that
trains everyone to ignore the alerts. The loop retries up to max_retries times, sleeping 0.5, 1, 2, 4... seconds
between attempts (exponential backoff), and only returns a failed CheckResult once every attempt has been exhausted.
3. Status code and body content
Checking only the HTTP status code misses a real and common failure mode: a reverse proxy or app server returning 200 with an
error page, a maintenance banner, or an empty response body because the upstream it’s proxying to is down. body_matches lets
you supply a regex that the response body must contain — typically a small JSON fragment like "status":"ok" from a proper
health endpoint — so a “technically 200 but actually broken” response still gets caught.
4. Timeouts are per-request, not per-check
http.open_timeout covers the TCP connection + TLS handshake; http.read_timeout covers waiting for the response
after the request is sent. Both are set from the same timeout value here for simplicity, but they’re independently
configurable if you need, say, a generous read timeout for a slow report-generation endpoint but a tight connect timeout to fail fast on a
genuinely unreachable host.
5. Alerting without a monitoring platform
send_webhook only fires if there’s at least one failure — healthy runs stay silent, which is what you want from something
running every minute via cron. The payload is generic JSON (text + a failures array), which is compatible as-is
with a lot of “generic incoming webhook” integrations; adjust the field names if your target expects Slack’s specific block-kit format or
a different schema.
Example Output
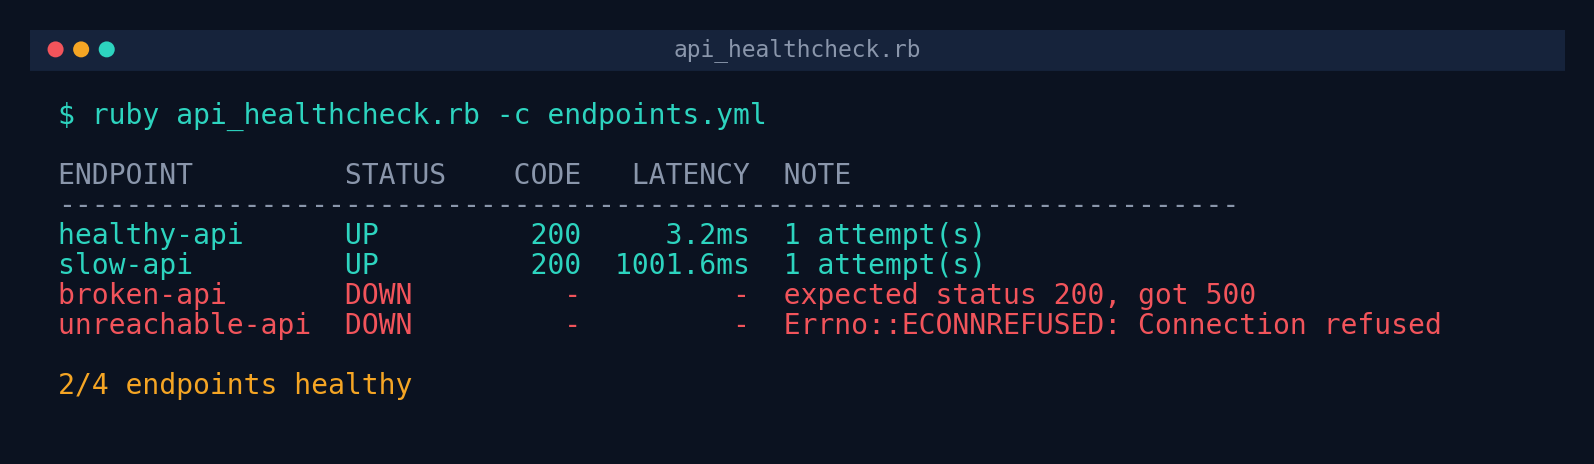
Tested against a local test server exposing a healthy endpoint, a slow-but-fine endpoint, one that returns HTTP 500, and one that’s unreachable — verifying both the retry logic and the report formatting:
The same run’s JSON output (useful for feeding a dashboard or log aggregator):
{
  "name": "broken-api",
  "url": "http://127.0.0.1:8081/broken",
  "ok": false,
  "status_code": null,
  "latency_ms": null,
  "attempts": 2,
  "error": "expected status 200, got 500"
}
Troubleshooting
| Symptom | Likely cause / fix |
|---|---|
| Every check fails with an SSL error | Corporate proxy doing TLS interception, or an outdated CA bundle. Check OpenSSL::X509::DEFAULT_CERT_FILE / SSL_CERT_FILE env var, and confirm with curl -v against the same URL first. |
Checks pass individually but the script reports DOWN when run from cron | Cron often runs with a minimal environment — no proxy variables, different DNS resolution. Reproduce with env -i ruby api_healthcheck.rb -c endpoints.yml to see what cron actually sees. |
body_matches never matches even though the text is clearly in the response | Remember it’s a regex, not a substring search — characters like ., (, [ need escaping if you meant them literally. Regexp.escape your string first if it’s not meant to be a pattern. |
| Retries make the whole run take too long | Backoff is exponential per endpoint, not shared — a handful of consistently-failing endpoints with high retries can add up. Lower --retries for a tight monitoring interval, or move to the parallel-check pattern described below. |
| Webhook never fires despite failures in the text report | Confirm --webhook was actually passed (it’s opt-in), and check send_webhook‘s rescue block isn’t silently swallowing a delivery error — temporarily remove the rescue while debugging. |
Extending This Script
- Parallel checks: for a longer endpoint list, reuse the bounded thread-pool pattern from the SSH fleet automation tutorial in this series so total run time doesn’t scale linearly with endpoint count.
- Historical latency tracking: append each JSON result to a rolling log file or push to a time-series store, so “is this slower than usual” becomes answerable, not just “is this up right now.”
- Certificate expiry checks: combine with the TLS/SSL certificate monitoring script elsewhere in this series to catch “still returns 200 today, but the cert expires in 3 days” before it becomes an outage.
- Maintenance windows: add a
silence_untilfield per endpoint so planned deploys don’t trigger false alerts. - Multiple webhook targets: accept a list instead of a single URL, and route based on severity (a single flaky endpoint vs. everything down at once).